Copyright
©The Author(s) 2023.
World J Gastrointest Oncol. Mar 15, 2023; 15(3): 372-388
Published online Mar 15, 2023. doi: 10.4251/wjgo.v15.i3.372
Published online Mar 15, 2023. doi: 10.4251/wjgo.v15.i3.372
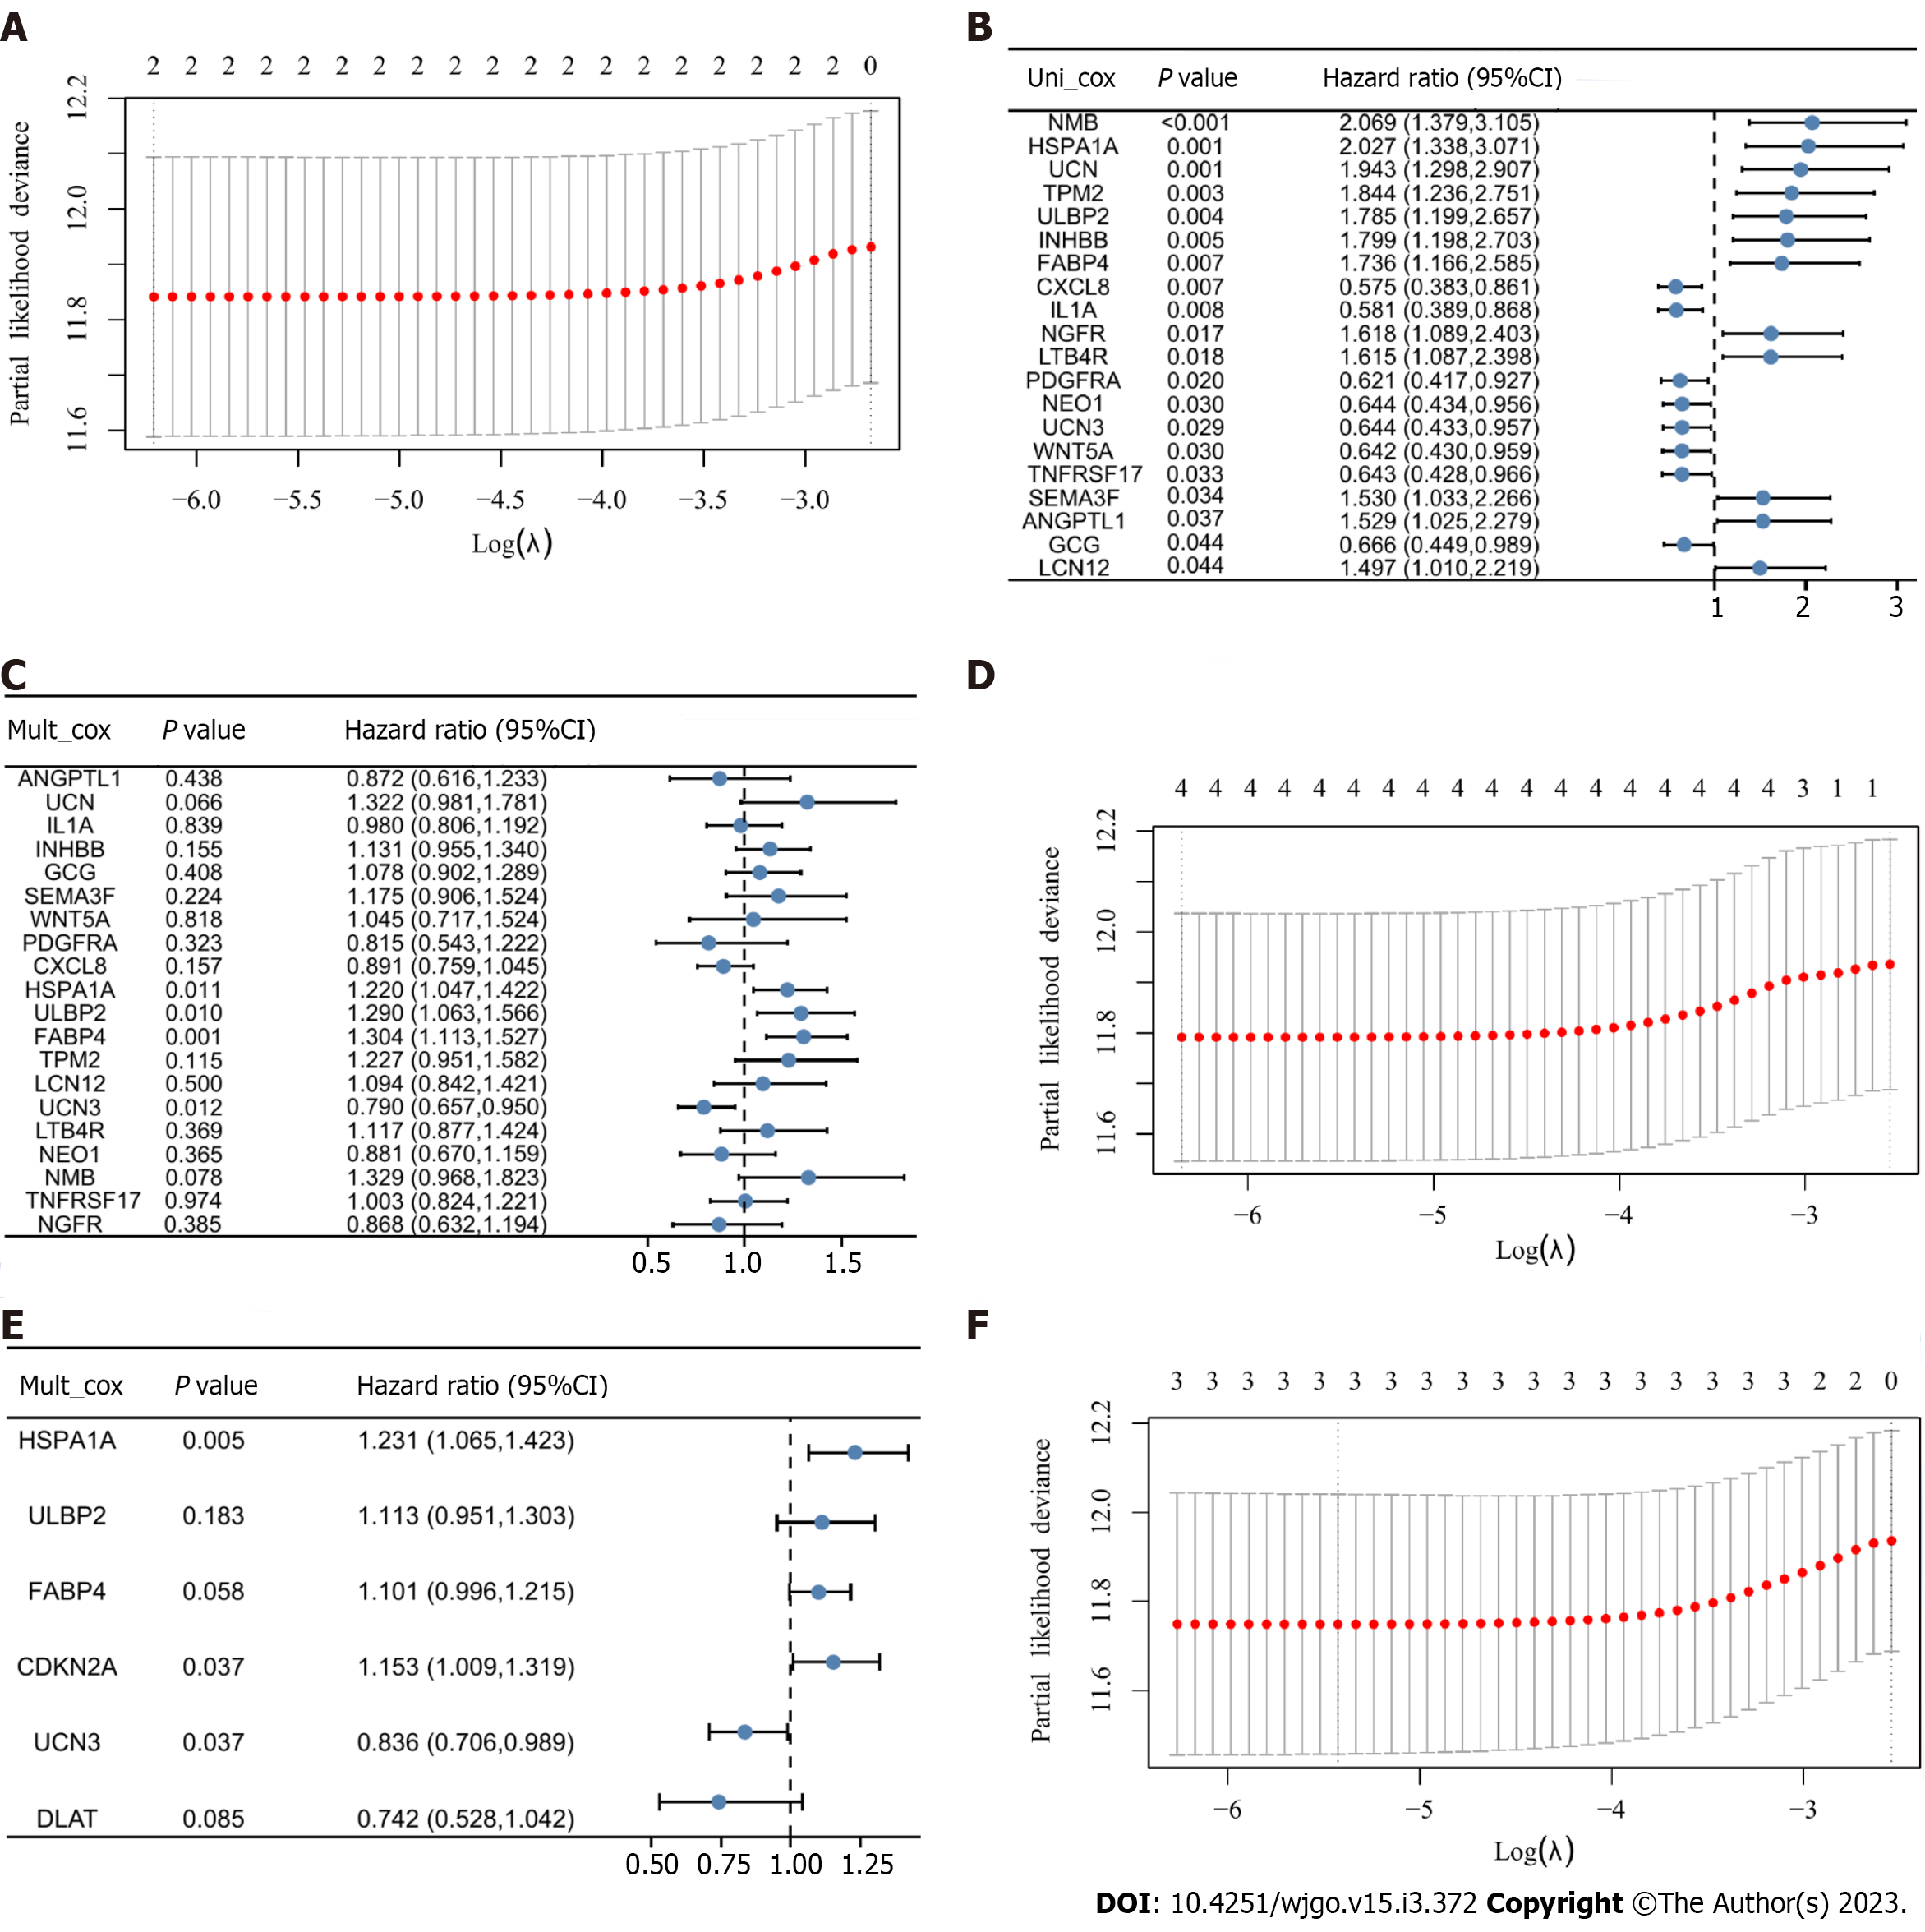
Figure 3 Identification of prognostic features and construction of risk scoring models.
A: Coefficient screening plot generated when the model was constructed using least absolute shrinkage and selection operator (LASSO) regression analysis with CDKN2A and DLAT as variables. When λ takes the minimum value, it is the best model; B: Univariate Cox regression analysis of immune-related differentially expressed genes (IR-DEGs) showed significant results; C: Multivariate Cox regression analysis of IR-DEGs identified four genes independently associated with prognosis; D: Coefficient screening plots generated when the model was constructed using LASSO regression analysis with UCN3, HSPA1A, ULBP2, and FABP4 as variables. When λ takes the minimum value, it is the best model; E: Multivariate Cox regression analysis of two cuproptosis-related (CR)-DEGs and four IR-DEGs. CIR-DEGs with P < 0.05 were independently associated with prognosis; F: Coefficient screening plots when the model was constructed with the selected CDKN2A, HSPA1A, and UCN3 variables.
- Citation: Huang YY, Bao TY, Huang XQ, Lan QW, Huang ZM, Chen YH, Hu ZD, Guo XG. Machine learning algorithm to construct cuproptosis- and immune-related prognosis prediction model for colon cancer. World J Gastrointest Oncol 2023; 15(3): 372-388
- URL: https://www.wjgnet.com/1948-5204/full/v15/i3/372.htm
- DOI: https://dx.doi.org/10.4251/wjgo.v15.i3.372


