Copyright
©The Author(s) 2023.
World J Gastrointest Oncol. Feb 15, 2023; 15(2): 303-317
Published online Feb 15, 2023. doi: 10.4251/wjgo.v15.i2.303
Published online Feb 15, 2023. doi: 10.4251/wjgo.v15.i2.303
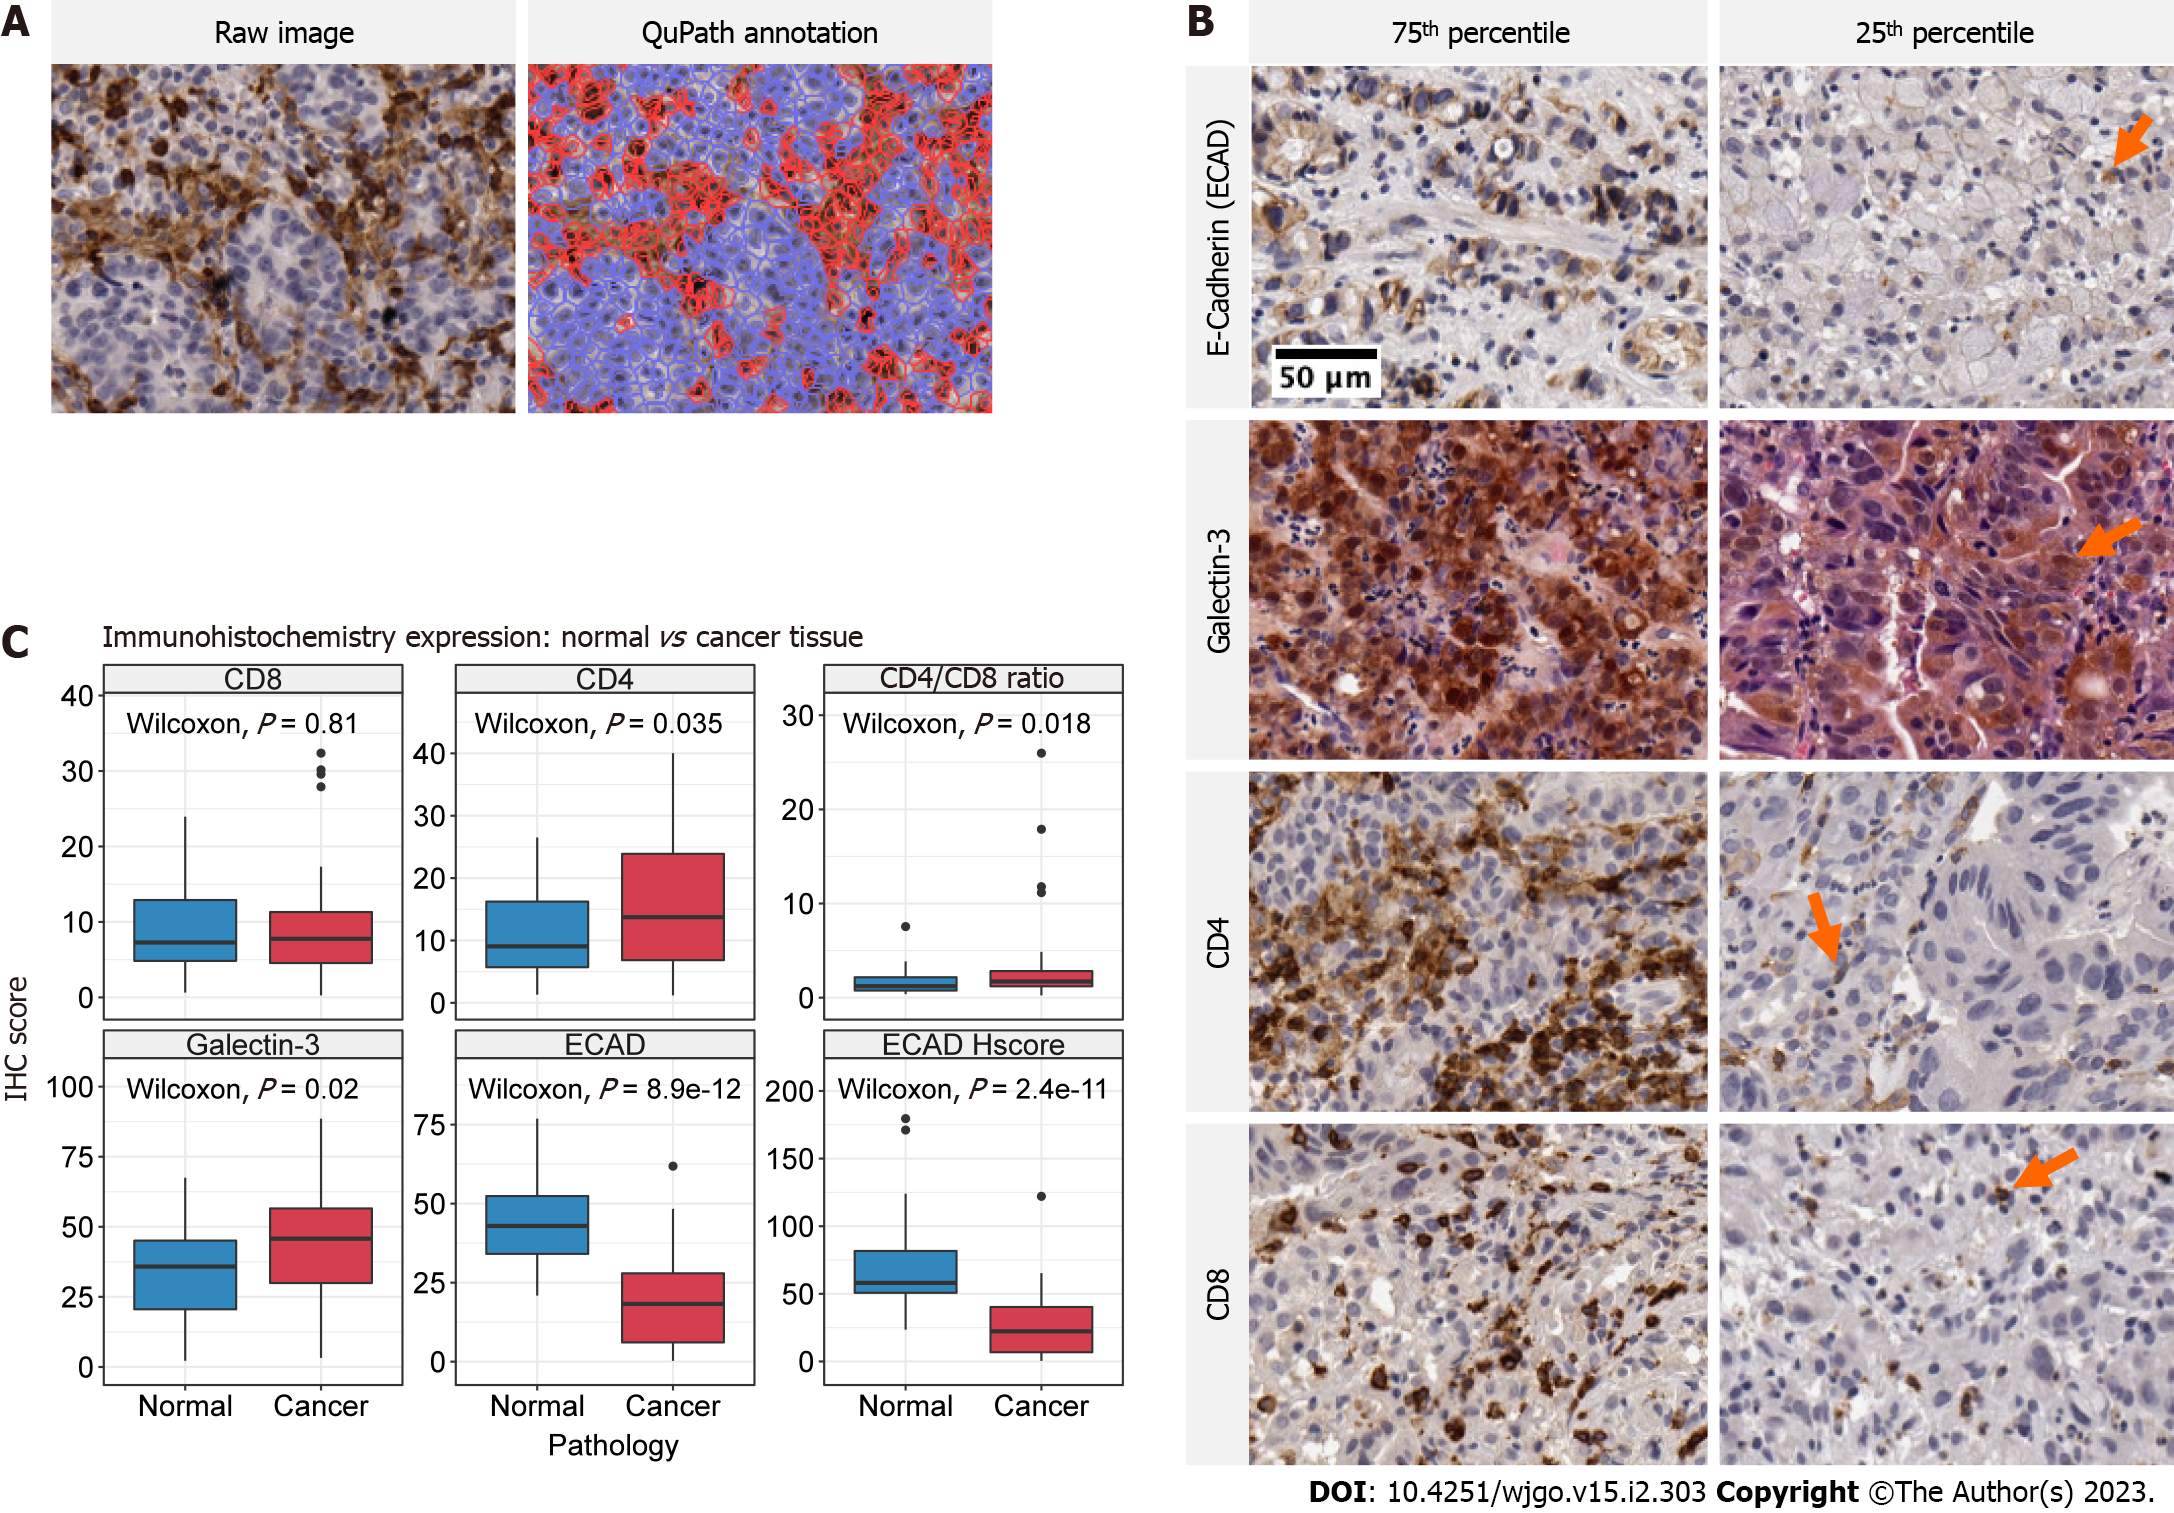
Figure 2 Immunohistochemistry stains and expression of biomarkers in treatment naïve normal and cancer tissue.
A: Representative images of QuPath digital pathology annotation using CD4 immunohistochemistry (IHC) at 10X magnification. Raw images (left) are processed and regions of interest are identified according to our methods. The annotated image (right) demonstrates the calculation of positive stained cells (red) and negative cells (blue); B: Representative IHC images taken at 10X magnification for each respective biomarker identified on the y-axis. Images of expression values within the 75th and 25th percentile are presented in the left and right columns, respectively. Arrows demonstrate positive staining in low expression specimens; C: Boxplot comparison of expression for each respective biomarker in treatment naive normal and cancer tissue. The IHC biomarker is labeled on the heading of each graph. The y-axis represents IHC score, which is the percent of positive stained cells for Galectin-3, CD4, CD8 and E-cadherin and the H-score for E-cadherin H-score plot. The x-axis labels the distribution corresponding to normal (blue) and cancer (red) tissue. The raw P value for Wilcoxon tests is annotated in each panel.
- Citation: Skubleny D, Lin A, Garg S, McLean R, McCall M, Ghosh S, Spratlin JL, Schiller D, Rayat G. Increased CD4/CD8 Lymphocyte ratio predicts favourable neoadjuvant treatment response in gastric cancer: A prospective pilot study. World J Gastrointest Oncol 2023; 15(2): 303-317
- URL: https://www.wjgnet.com/1948-5204/full/v15/i2/303.htm
- DOI: https://dx.doi.org/10.4251/wjgo.v15.i2.303


