Copyright
©The Author(s) 2023.
World J Gastrointest Oncol. Dec 15, 2023; 15(12): 2101-2110
Published online Dec 15, 2023. doi: 10.4251/wjgo.v15.i12.2101
Published online Dec 15, 2023. doi: 10.4251/wjgo.v15.i12.2101
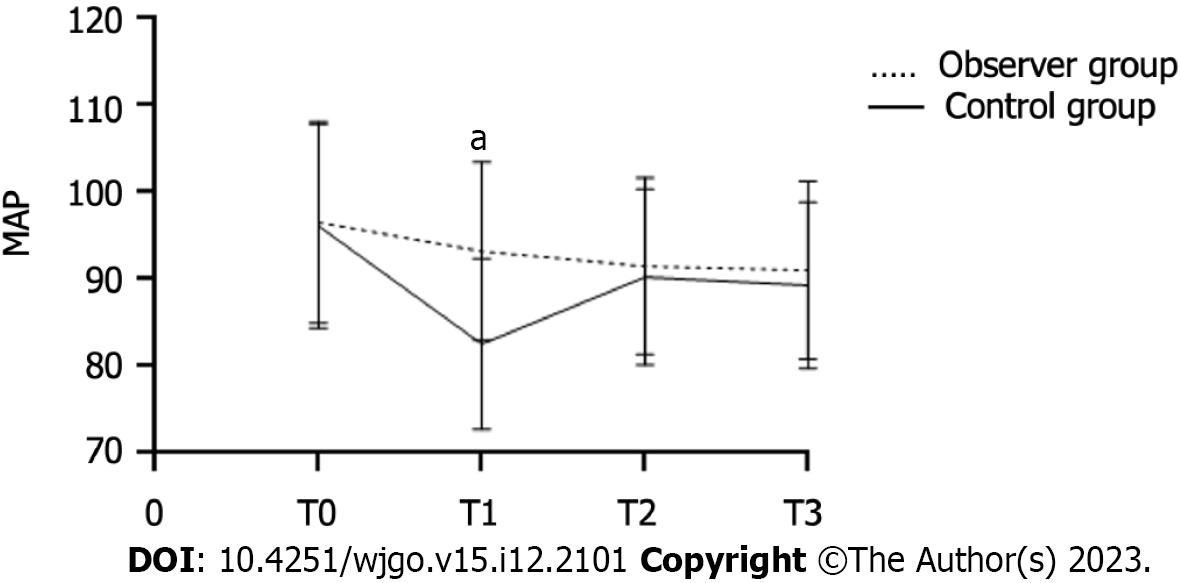
Figure 2 Comparison of mean arterial pressure at different time points between the two groups.
aP < 0.05. MAP: Mean arterial pressure; T0: Before anesthesia induction; T1: 1 min after induction; T2: Immediately after tracheal intubation; T3: Upon leaving the operating room.
- Citation: Liu J, Tian JM, Liu GZ, Sun JN, Gao PF, Zhang YQ, Yue XQ. Application of remimazolam transversus abdominis plane block in gastrointestinal tumor surgery. World J Gastrointest Oncol 2023; 15(12): 2101-2110
- URL: https://www.wjgnet.com/1948-5204/full/v15/i12/2101.htm
- DOI: https://dx.doi.org/10.4251/wjgo.v15.i12.2101


