Copyright
©The Author(s) 2023.
World J Gastrointest Oncol. Nov 15, 2023; 15(11): 1974-1987
Published online Nov 15, 2023. doi: 10.4251/wjgo.v15.i11.1974
Published online Nov 15, 2023. doi: 10.4251/wjgo.v15.i11.1974
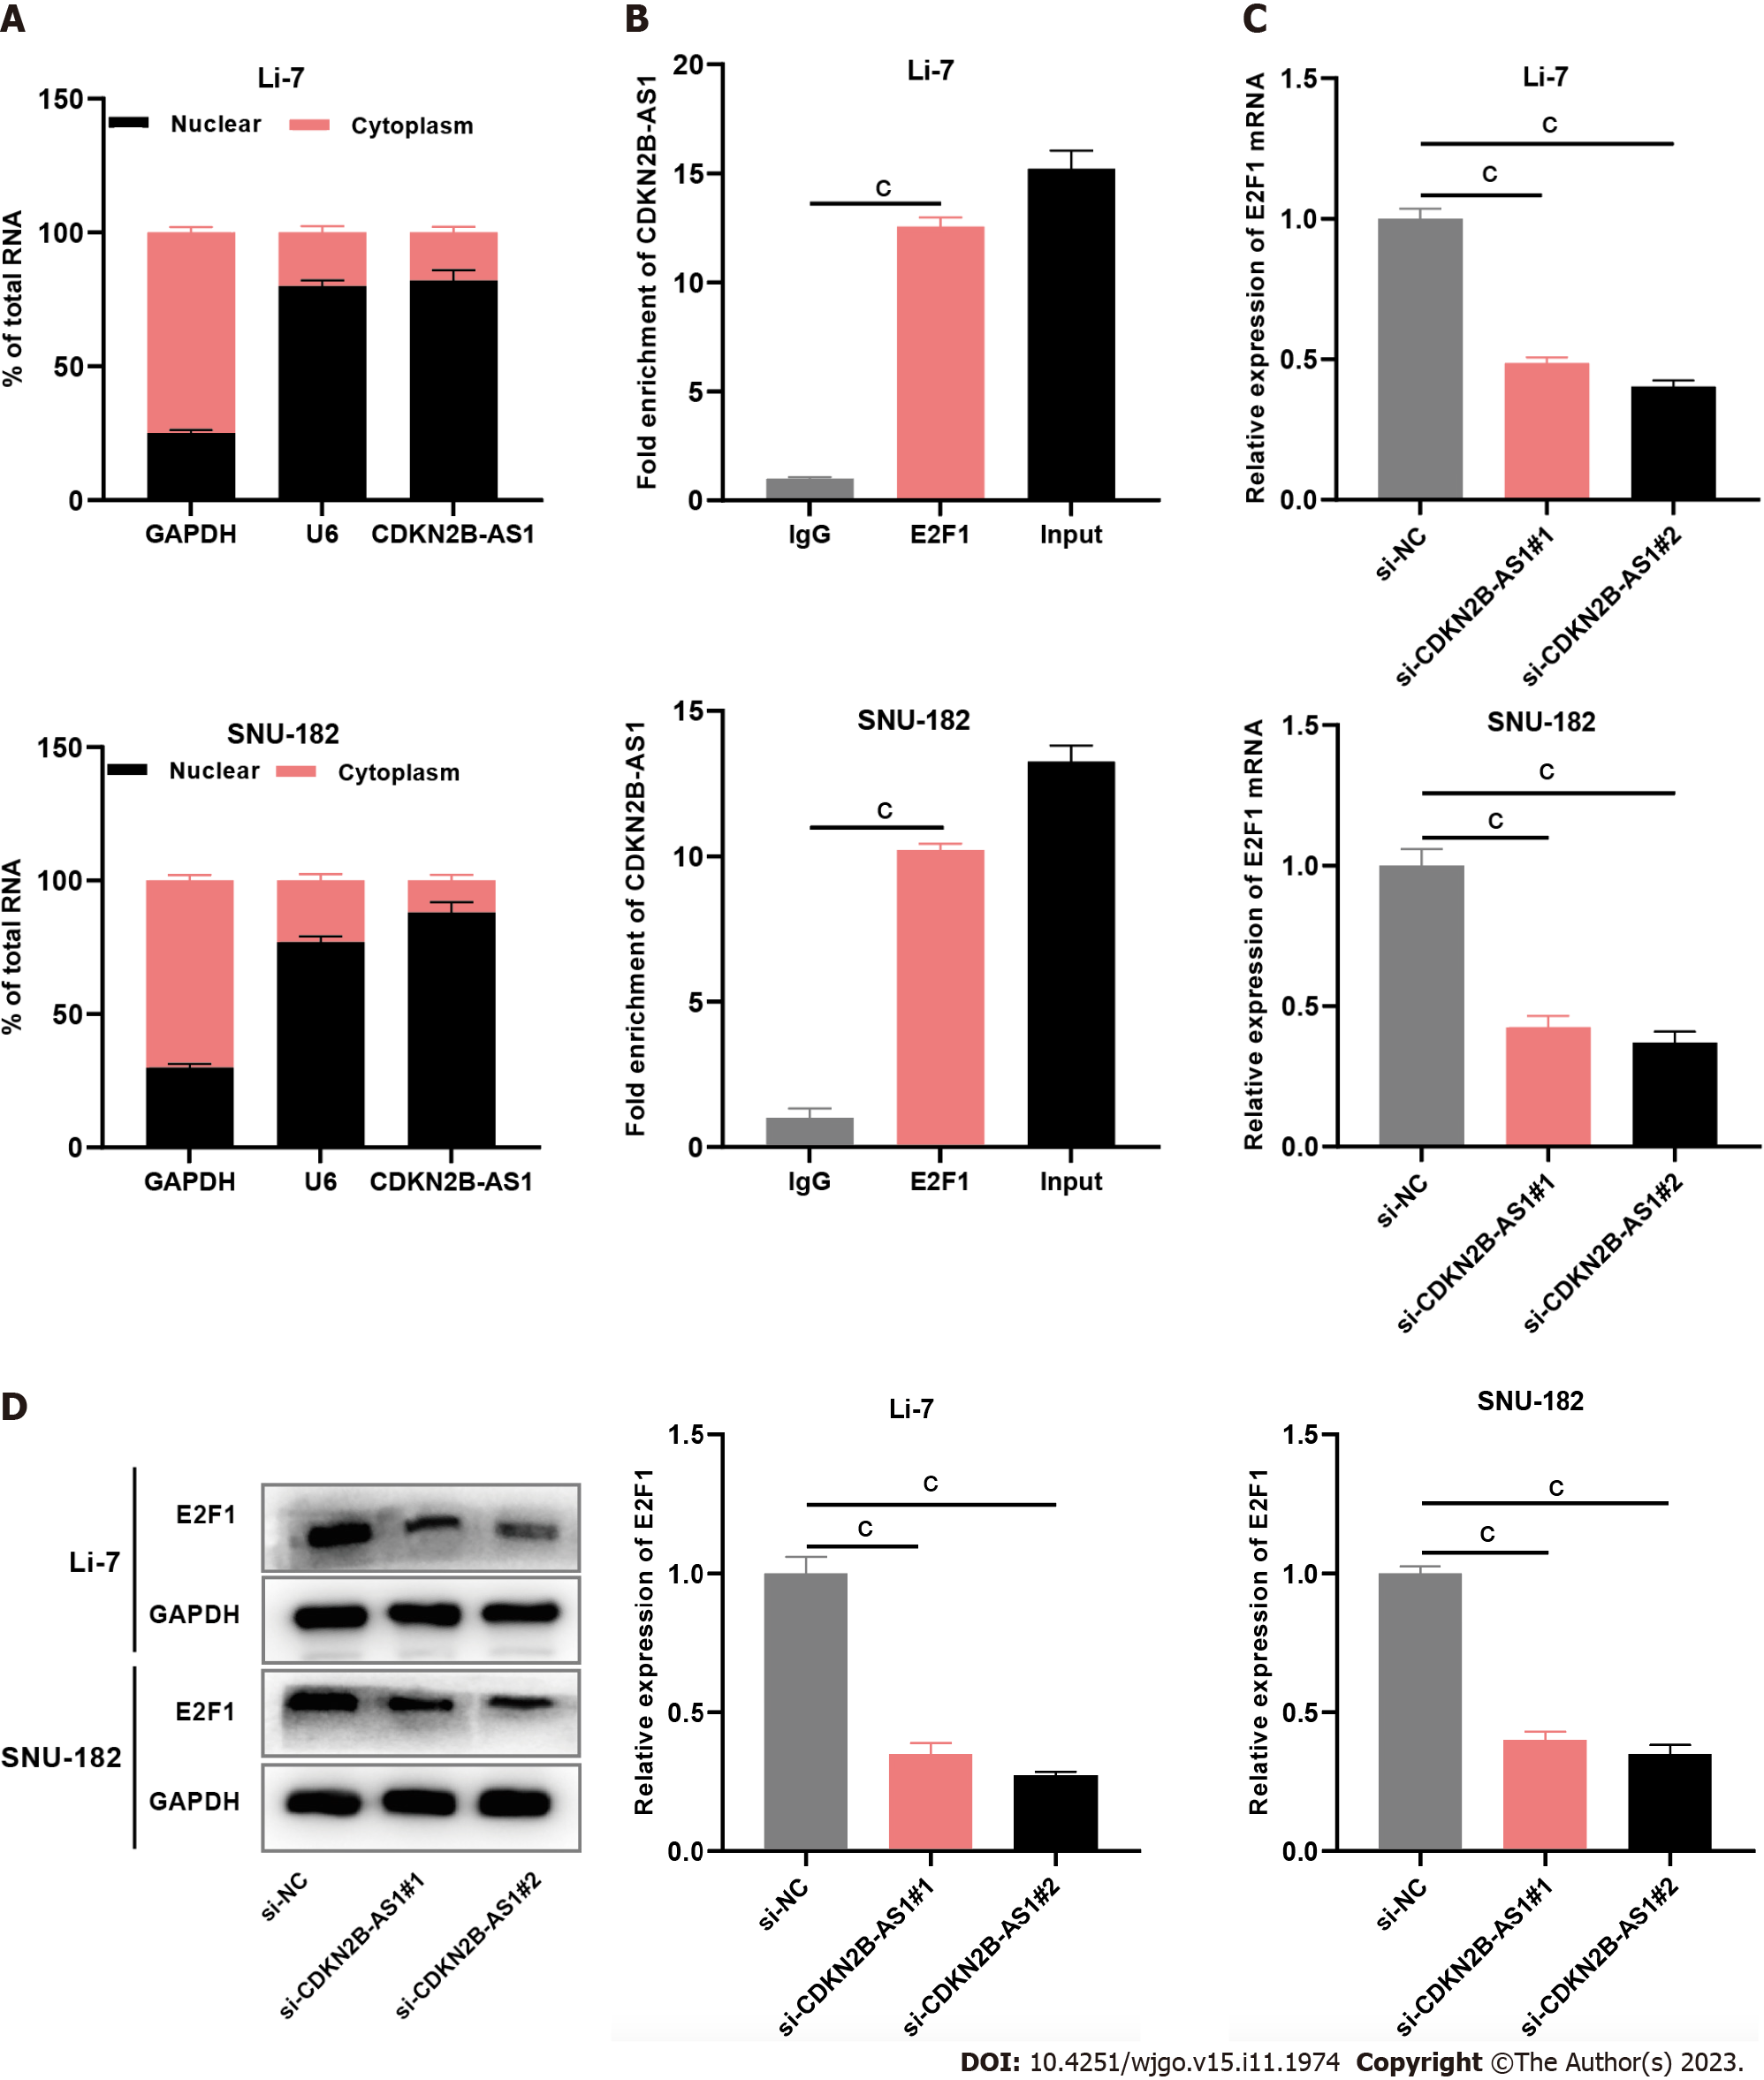
Figure 3 CDKN2B-AS1 interacts with transcription factor E2F transcription factor 1.
A: Bar charts showing CDKN2B-AS1, U6, and GAPDH expressions in the nucleus faction (black part of the column) and cytoplasm fraction (pink part of the column) of Li-7 (left chart) and SNU-182 (right chart) cells detected by subcellular grading assay; B: Bar charts showing the fold enrichment of CDKN2B-AS1 from immunoglobulin G, E2F transcription factor 1 (E2F1), and total input, separately, in Li-7 and SNU-182 cells detected by RNA immunoprecipitation assays; C and D: Bar charts showing the expression levels of E2F1 in Li-7 and SNU-182 cells, after depletion of CDKN2B-AS1, examined by quantitative real-time polymerase chain reaction (C) and western blot assays (D). cP < 0.001. E2F1: E2F transcription factor 1.
- Citation: Tao ZG, Yuan YX, Wang GW. Long non-coding RNA CDKN2B-AS1 promotes hepatocellular carcinoma progression via E2F transcription factor 1/G protein subunit alpha Z axis. World J Gastrointest Oncol 2023; 15(11): 1974-1987
- URL: https://www.wjgnet.com/1948-5204/full/v15/i11/1974.htm
- DOI: https://dx.doi.org/10.4251/wjgo.v15.i11.1974


