Copyright
©The Author(s) 2022.
World J Gastrointest Oncol. Sep 15, 2022; 14(9): 1739-1757
Published online Sep 15, 2022. doi: 10.4251/wjgo.v14.i9.1739
Published online Sep 15, 2022. doi: 10.4251/wjgo.v14.i9.1739
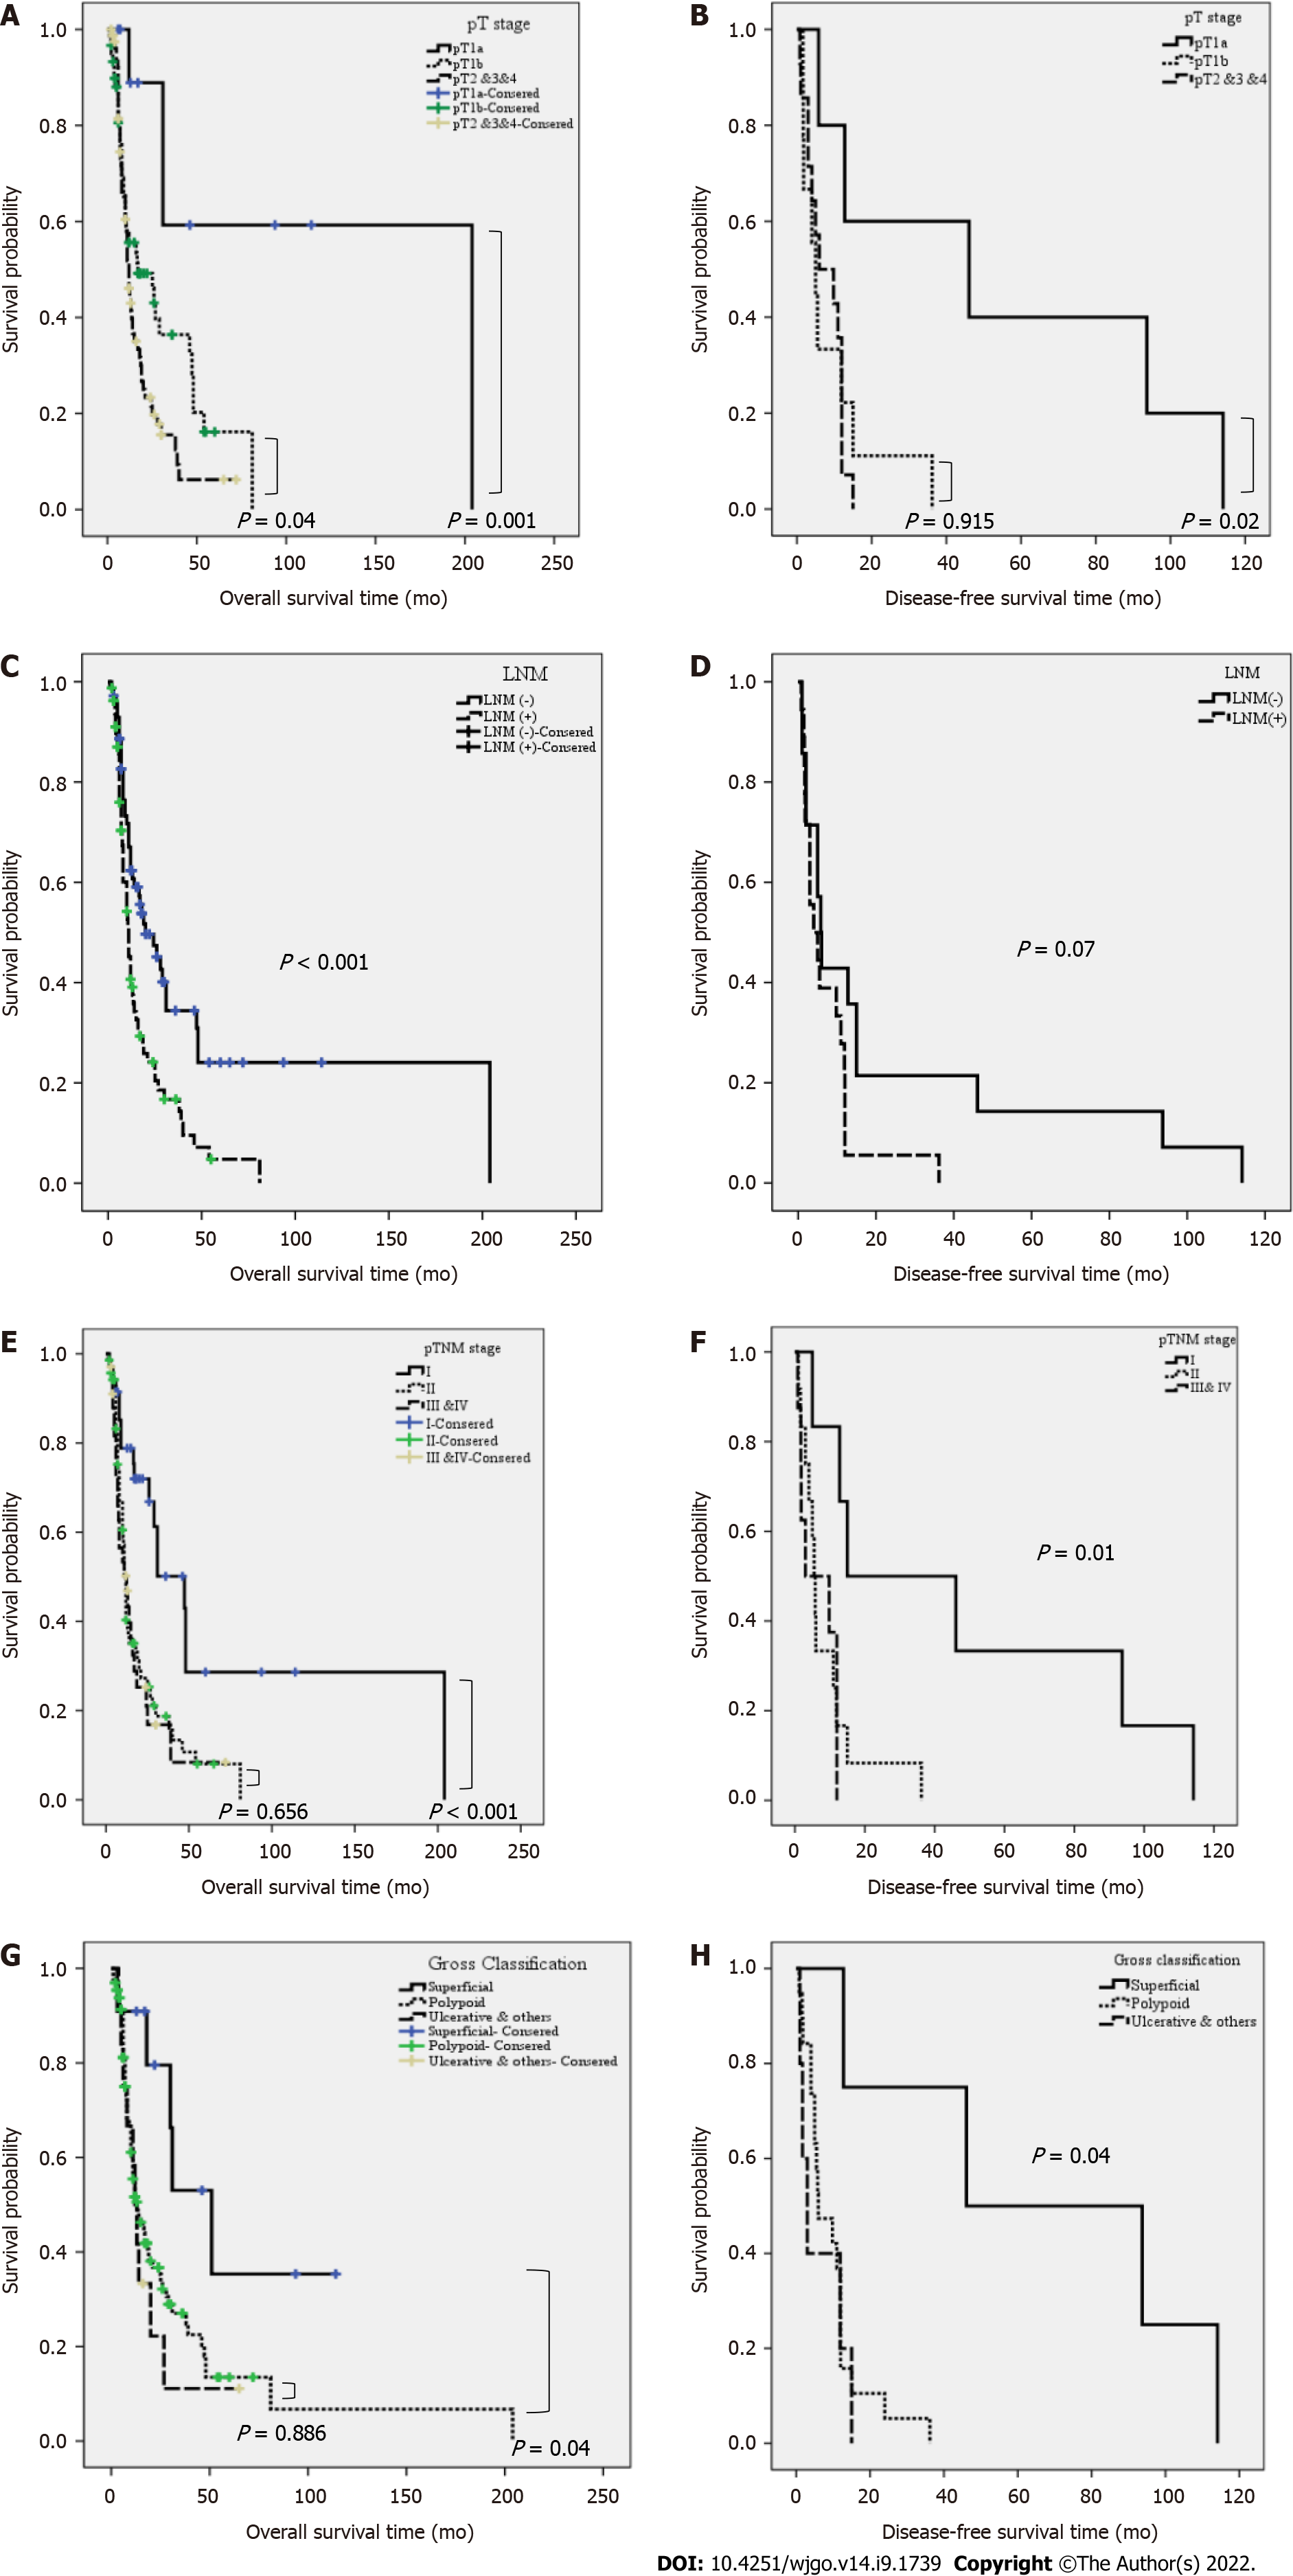
Figure 5 Kaplan-Meier curves for patients with primary malignant melanoma of the esophagus.
A and B: Comparison between the cases with pT1a, pT1b, and pT2, 3, and 4. Patients at pT1a showed a much better overall survival (OS) and disease-free survival (DFS) than those at pT1b or pT2, 3, and 4. No significant difference was observed between groups at pT1b and pT2, 3, and 4 for OS or DFS; C and D: Comparison between the cases with (+) and without (-) lymph node metastasis (LNM). Patients with LNM (+) showed a lower OS than those with LNM (-); for DFS, the difference was only marginal (P = 0.07); E and F: Comparison between the cases with pTNM I, II, and III/IV. Patients at pTNM I showed a much better OS and DFS than those at II and III-IV. No significant difference was noted between groups at pTNM II and III-IV for OS or DFS; G and H: Comparison between the cases with superficial, polypoid, and other gross classifications. Groups with superficial subtype showed a better OS and DFS than those with other subtypes. No significant difference was noted between groups with polypoid and other subtypes for OS or DFS.
- Citation: Zhou SL, Zhang LQ, Zhao XK, Wu Y, Liu QY, Li B, Wang JJ, Zhao RJ, Wang XJ, Chen Y, Wang LD, Kong LF. Clinicopathological characterization of ten patients with primary malignant melanoma of the esophagus and literature review. World J Gastrointest Oncol 2022; 14(9): 1739-1757
- URL: https://www.wjgnet.com/1948-5204/full/v14/i9/1739.htm
- DOI: https://dx.doi.org/10.4251/wjgo.v14.i9.1739


