Copyright
©The Author(s) 2022.
World J Gastrointest Oncol. Jul 15, 2022; 14(7): 1265-1280
Published online Jul 15, 2022. doi: 10.4251/wjgo.v14.i7.1265
Published online Jul 15, 2022. doi: 10.4251/wjgo.v14.i7.1265
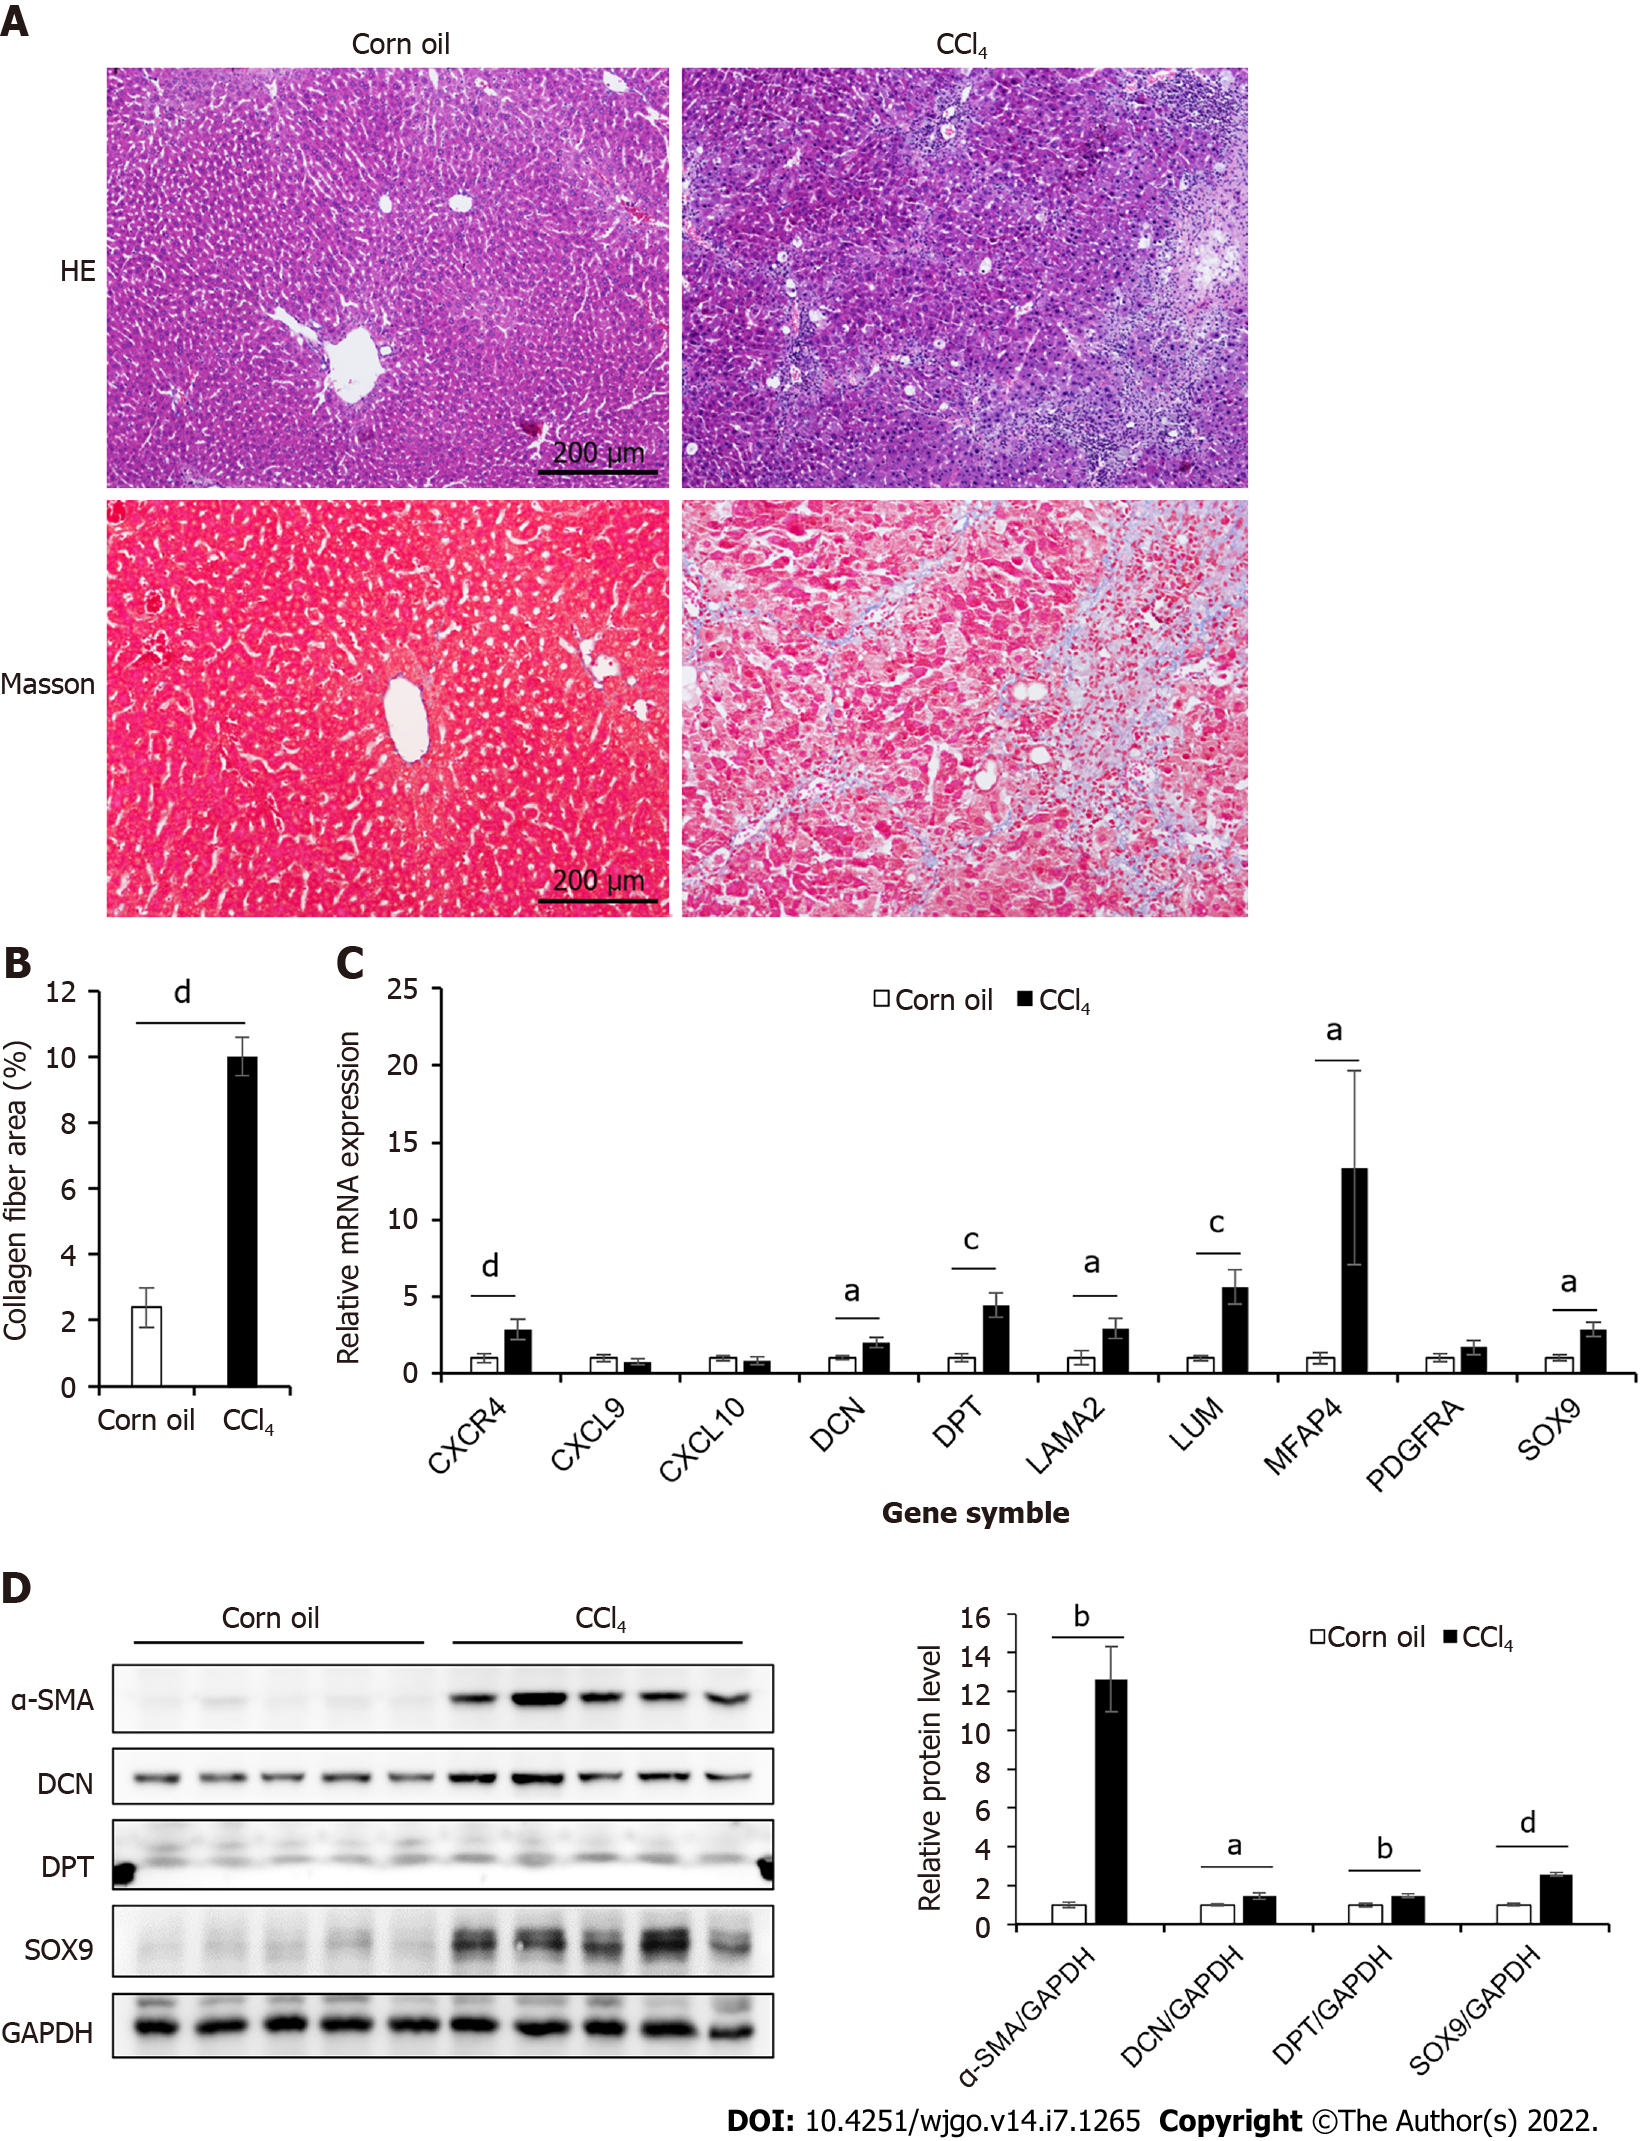
Figure 2 Expression of hub genes in the liver tissue of CCl4-induced mouse mice.
A: Masson’s trichrome and HE staining of control and CCl4-induced liver cirrhosis mouse liver tissues; B: Collagen area in Masson’s trichrome staining (n = 7 or 8); C: The mRNA expression levels of 10 hub genes of control and CCl4-induced cirrhosis mouse liver tissues (n = 6); D: The protein expression levels of α-SMA, Decorin (DCN), Dermatopontin (DPT), and SRY-box transcription factor 9 (SOX9) in liver tissues of mice in two groups. The right panel showed the result of quantitative analysis (n = 4). All data were presented as mean ± SE. Two-tailed Student’s t test were performed. aP < 0.05, bP < 0.01, cP < 0.001, dP < 0.0001.
- Citation: Li Y, Yuan SL, Yin JY, Yang K, Zhou XG, Xie W, Wang Q. Differences of core genes in liver fibrosis and hepatocellular carcinoma: Evidence from integrated bioinformatics and immunohistochemical analysis. World J Gastrointest Oncol 2022; 14(7): 1265-1280
- URL: https://www.wjgnet.com/1948-5204/full/v14/i7/1265.htm
- DOI: https://dx.doi.org/10.4251/wjgo.v14.i7.1265


