Copyright
©The Author(s) 2022.
World J Gastrointest Oncol. Jul 15, 2022; 14(7): 1265-1280
Published online Jul 15, 2022. doi: 10.4251/wjgo.v14.i7.1265
Published online Jul 15, 2022. doi: 10.4251/wjgo.v14.i7.1265
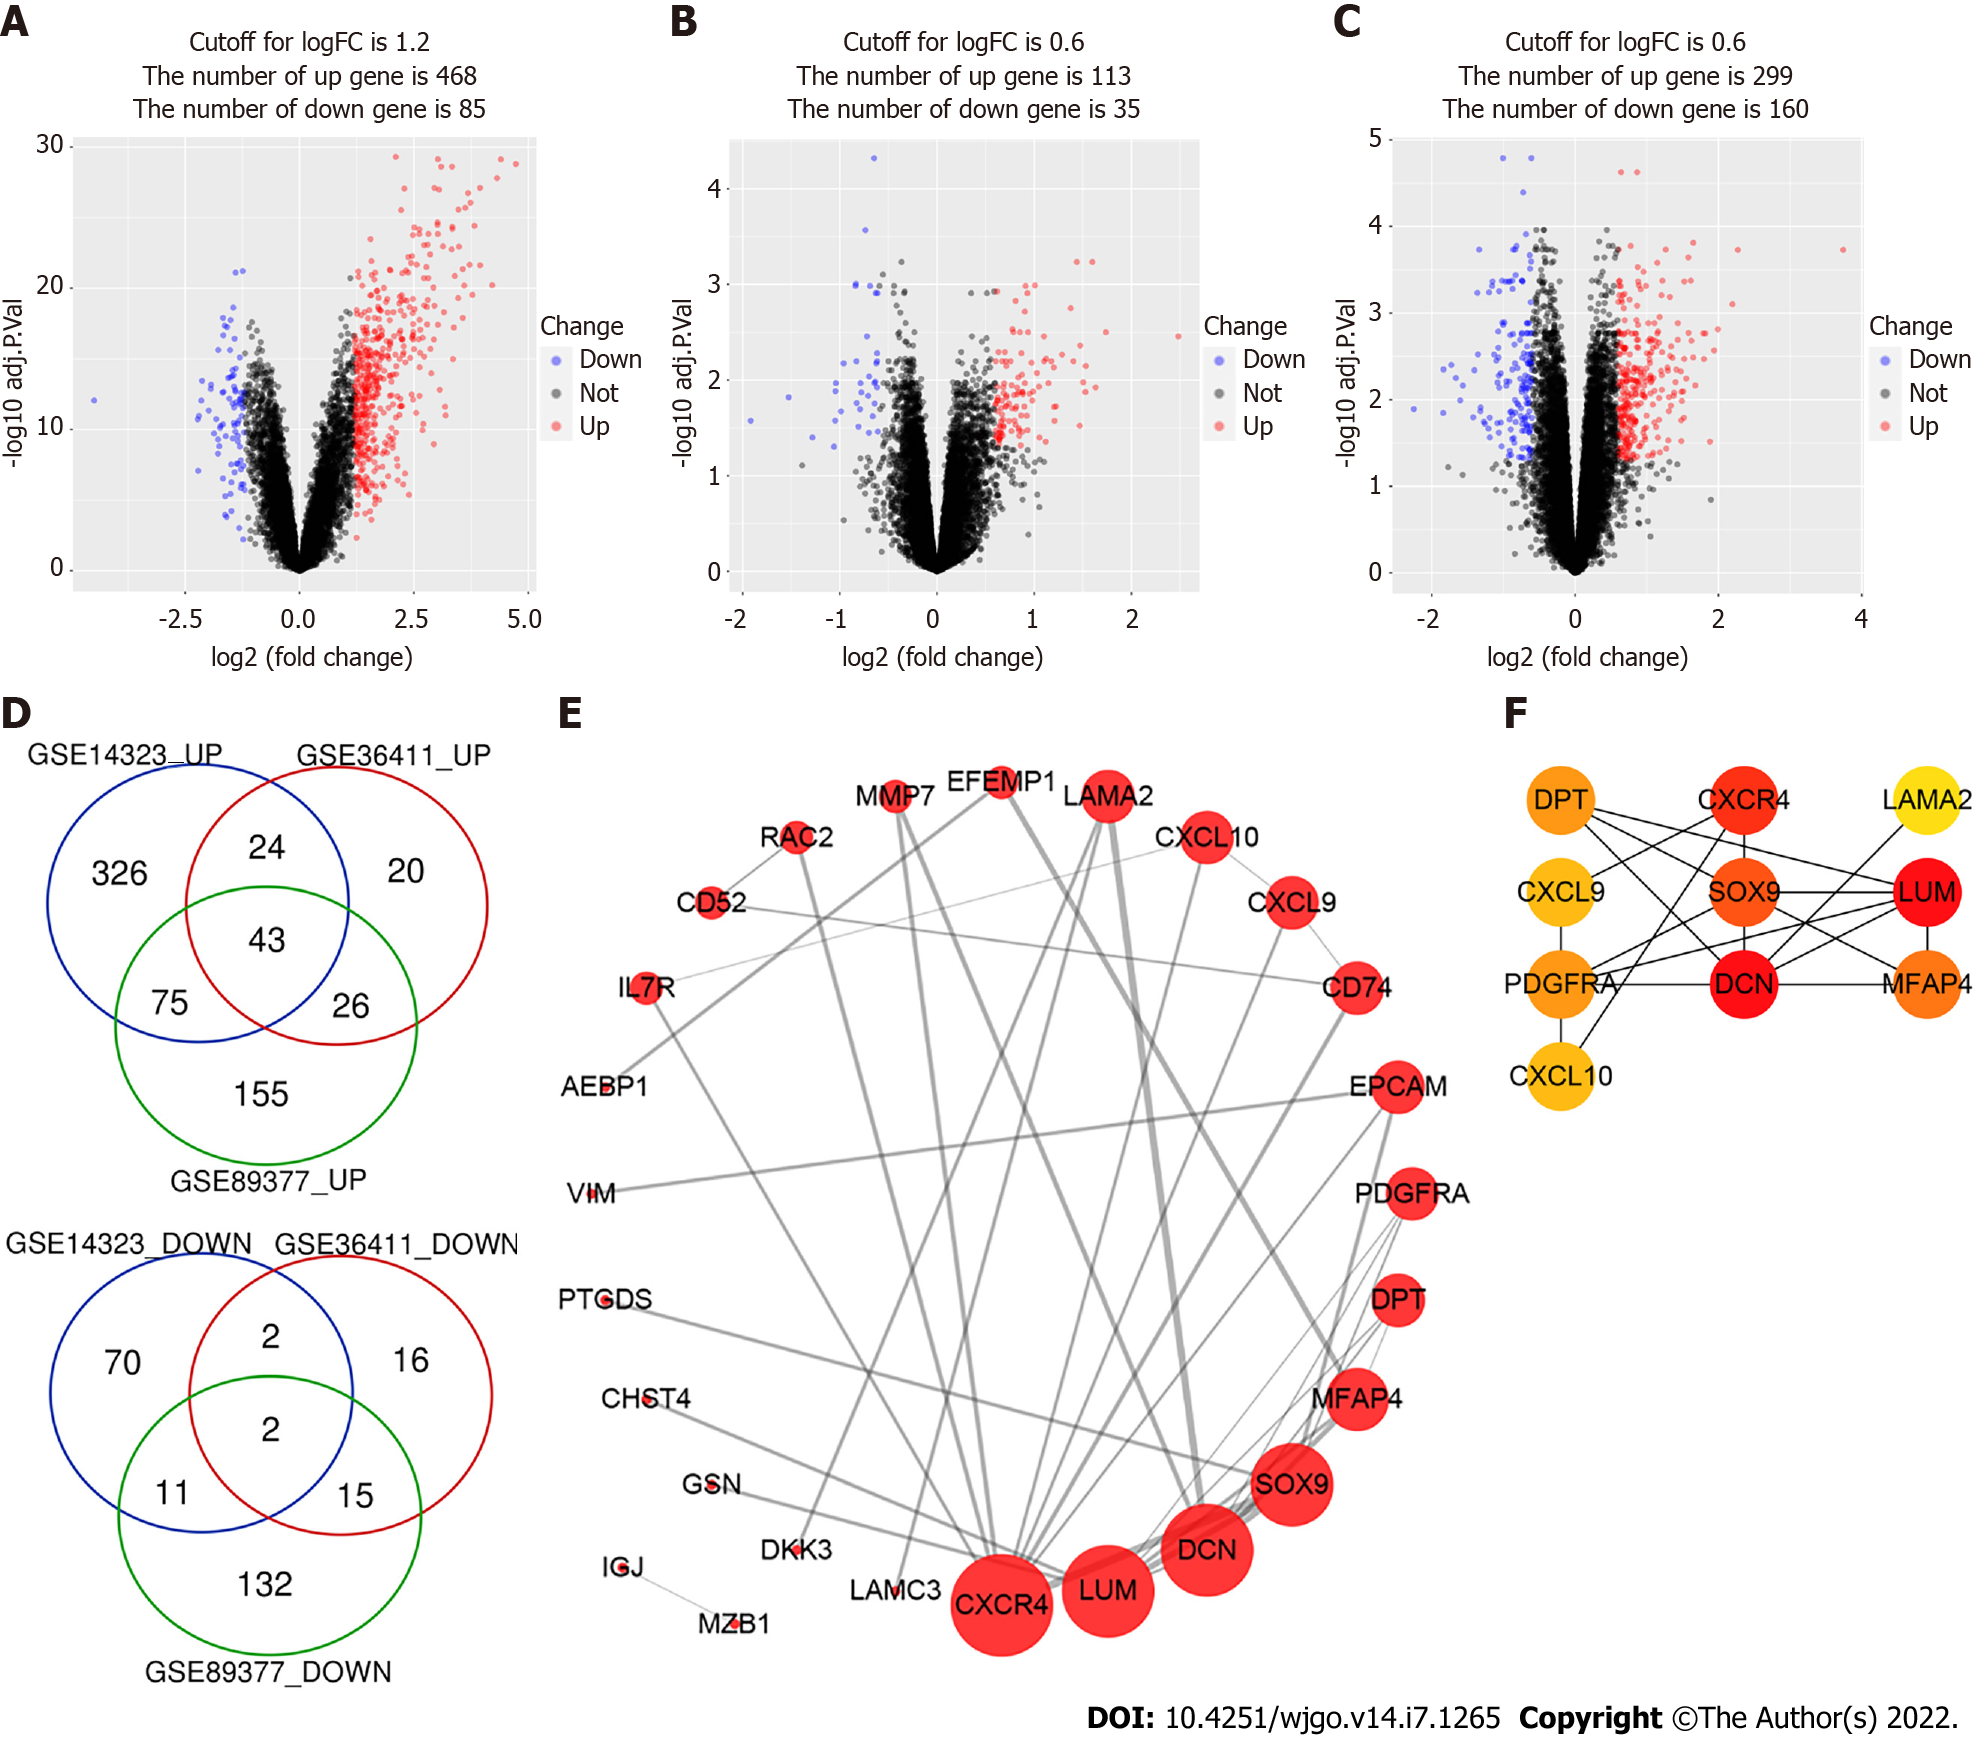
Figure 1 Identification of differentially expressed genes.
A-C: The volcano plots of GSE14323, GSE36411 and GSE89377. The red dots and blue dots represent up-regulated and downregulated genes, respectively; D: The Venn diagram software identified 45 common differentially expressed genes (DEGs) in three datasets (GSE14323, GSE36411 and GSE89377), including 43 upregulated genes and 2 downregulated genes; E: protein-protein interaction network of DEGs was constructed by STRING online database and drew by Cytoscape software; F: Top 10 hub genes of DEGs were identified by cytoHubba plug-in of Cytoscape and their importance were represented by their color’s shade.
- Citation: Li Y, Yuan SL, Yin JY, Yang K, Zhou XG, Xie W, Wang Q. Differences of core genes in liver fibrosis and hepatocellular carcinoma: Evidence from integrated bioinformatics and immunohistochemical analysis. World J Gastrointest Oncol 2022; 14(7): 1265-1280
- URL: https://www.wjgnet.com/1948-5204/full/v14/i7/1265.htm
- DOI: https://dx.doi.org/10.4251/wjgo.v14.i7.1265


