Copyright
©The Author(s) 2022.
World J Gastrointest Oncol. Apr 15, 2022; 14(4): 935-946
Published online Apr 15, 2022. doi: 10.4251/wjgo.v14.i4.935
Published online Apr 15, 2022. doi: 10.4251/wjgo.v14.i4.935
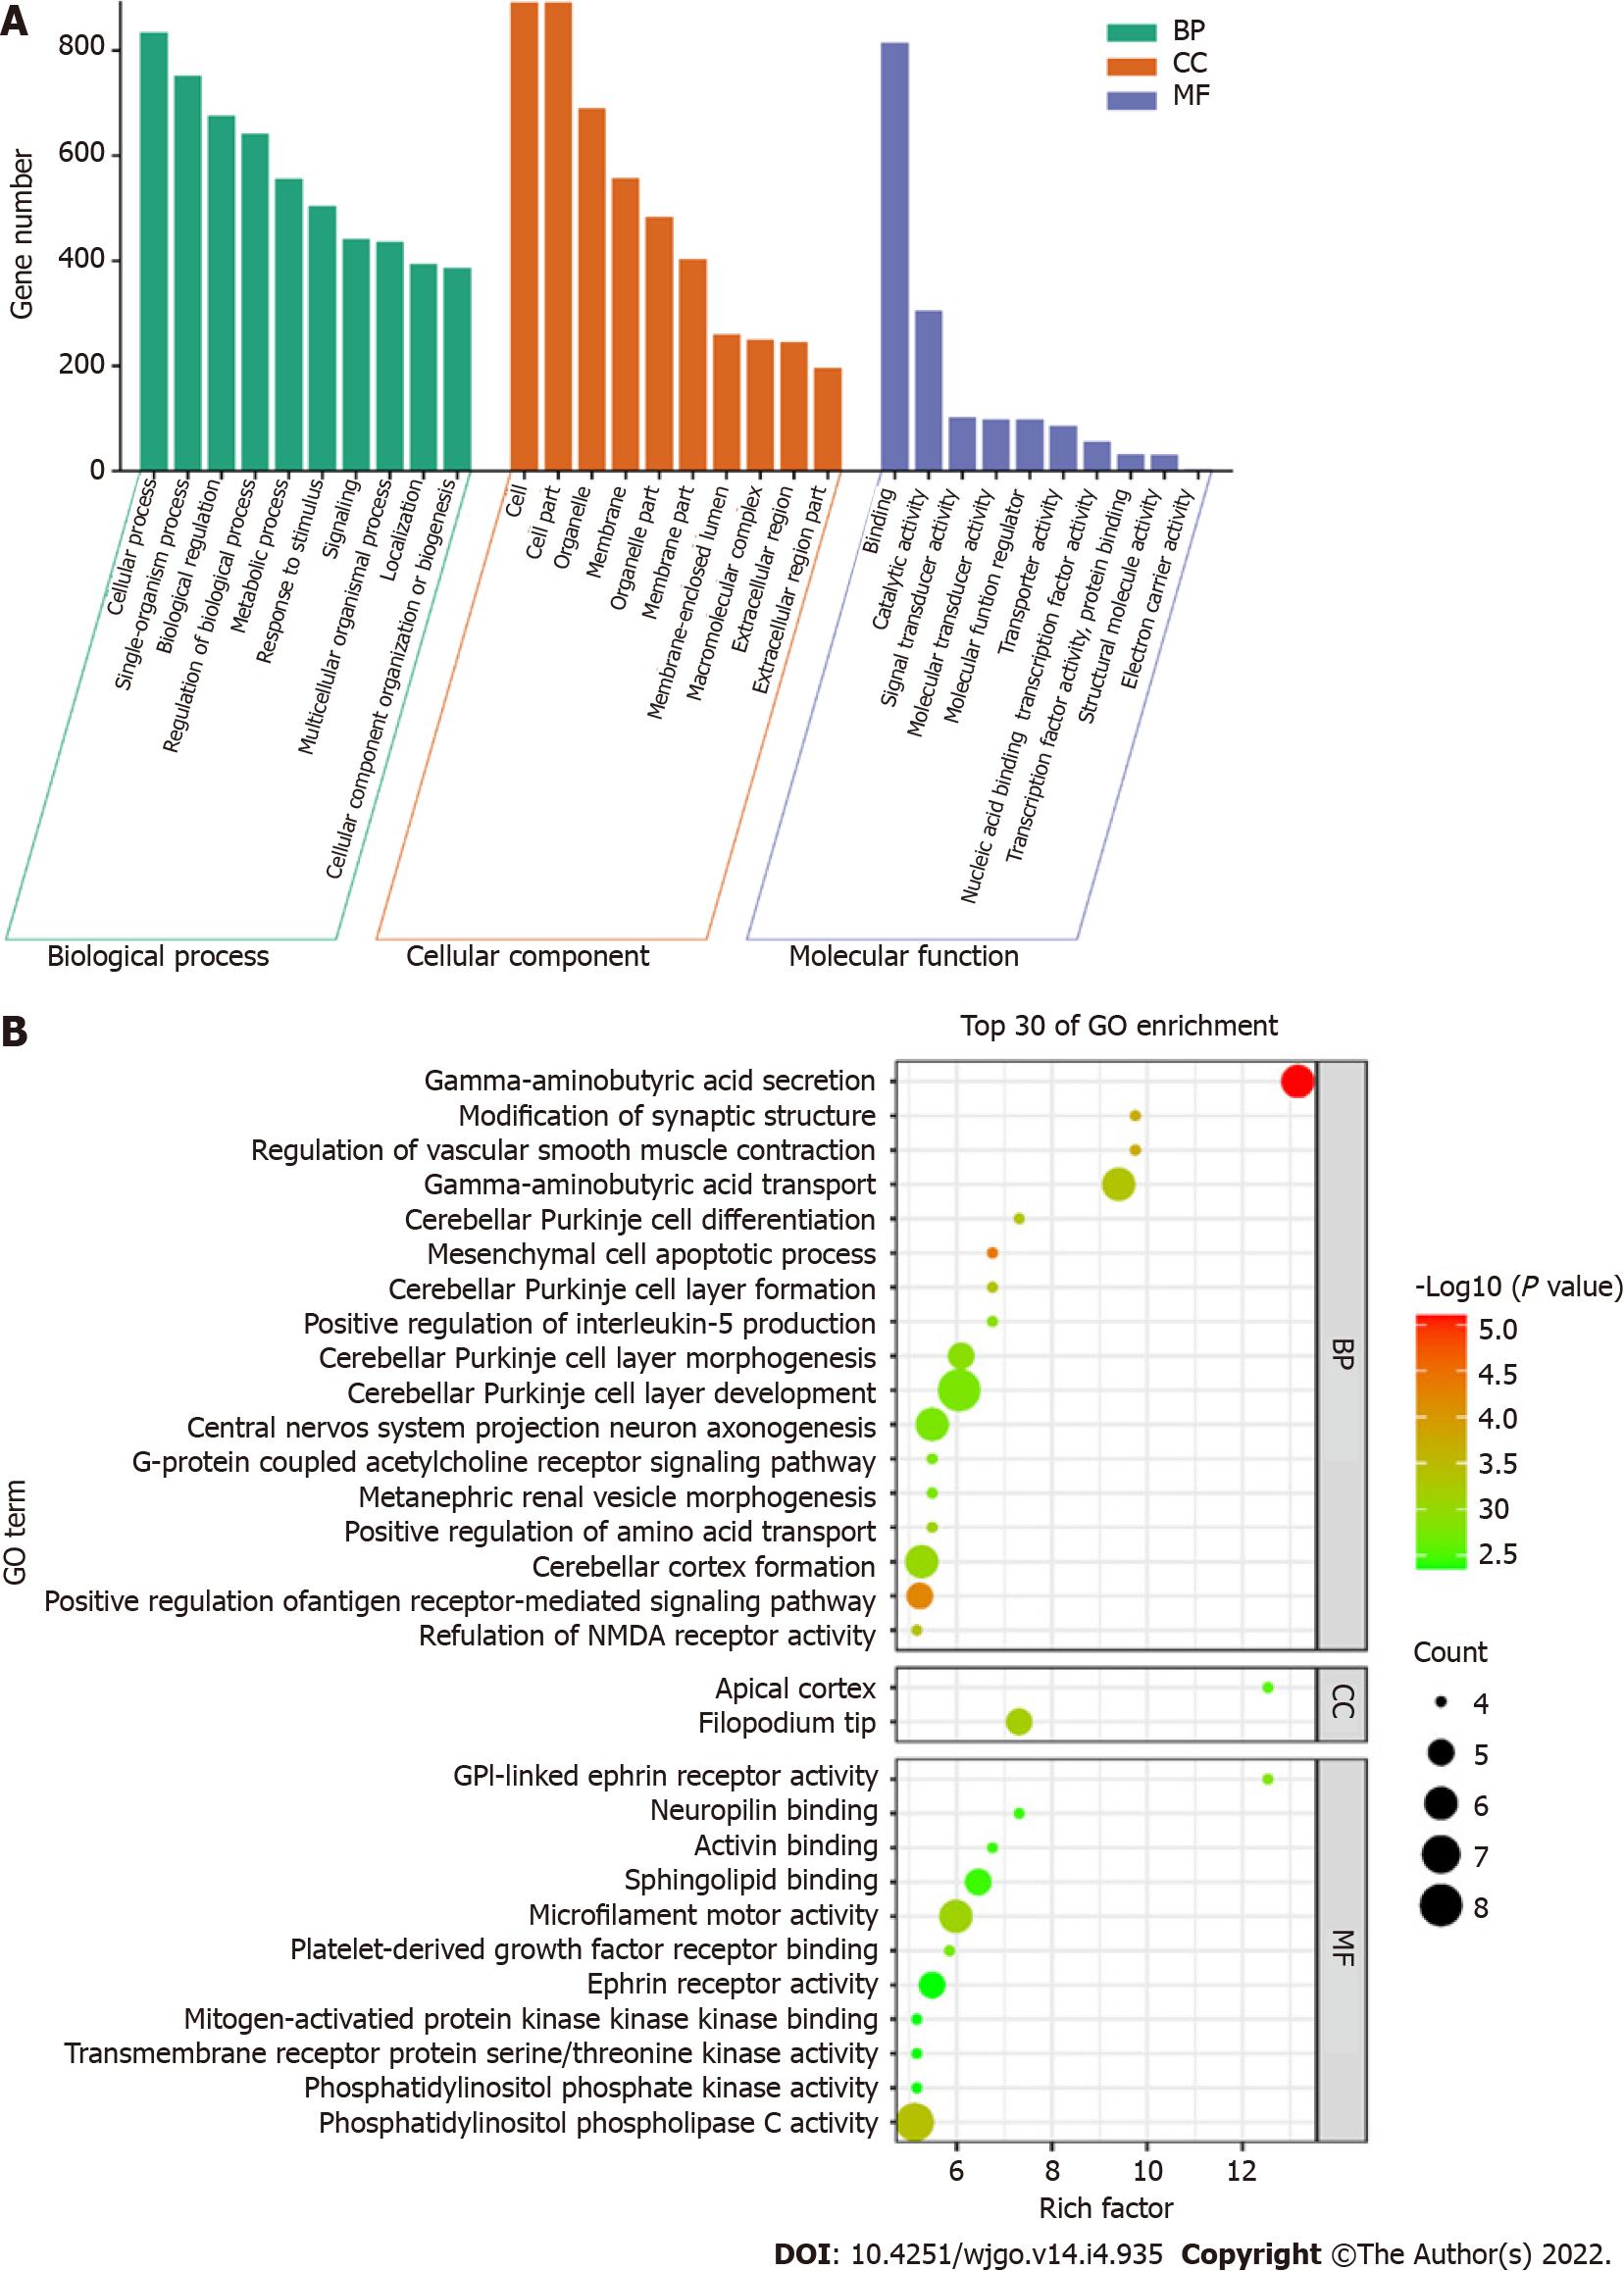
Figure 4 Gene ontology analysis.
A: Gene ontology (GO) function distribution of differentially methylated sites; B: Bubble diagram of GO enrichment results. GO: Gene ontology; BP: Biological process; CC: Cellular component; MF: Molecular function.
- Citation: Wu YL, Jiang T, Huang W, Wu XY, Zhang PJ, Tian YP. Genome-wide methylation profiling of early colorectal cancer using an Illumina Infinium Methylation EPIC BeadChip. World J Gastrointest Oncol 2022; 14(4): 935-946
- URL: https://www.wjgnet.com/1948-5204/full/v14/i4/935.htm
- DOI: https://dx.doi.org/10.4251/wjgo.v14.i4.935


