Copyright
©The Author(s) 2022.
World J Gastrointest Oncol. Feb 15, 2022; 14(2): 478-497
Published online Feb 15, 2022. doi: 10.4251/wjgo.v14.i2.478
Published online Feb 15, 2022. doi: 10.4251/wjgo.v14.i2.478
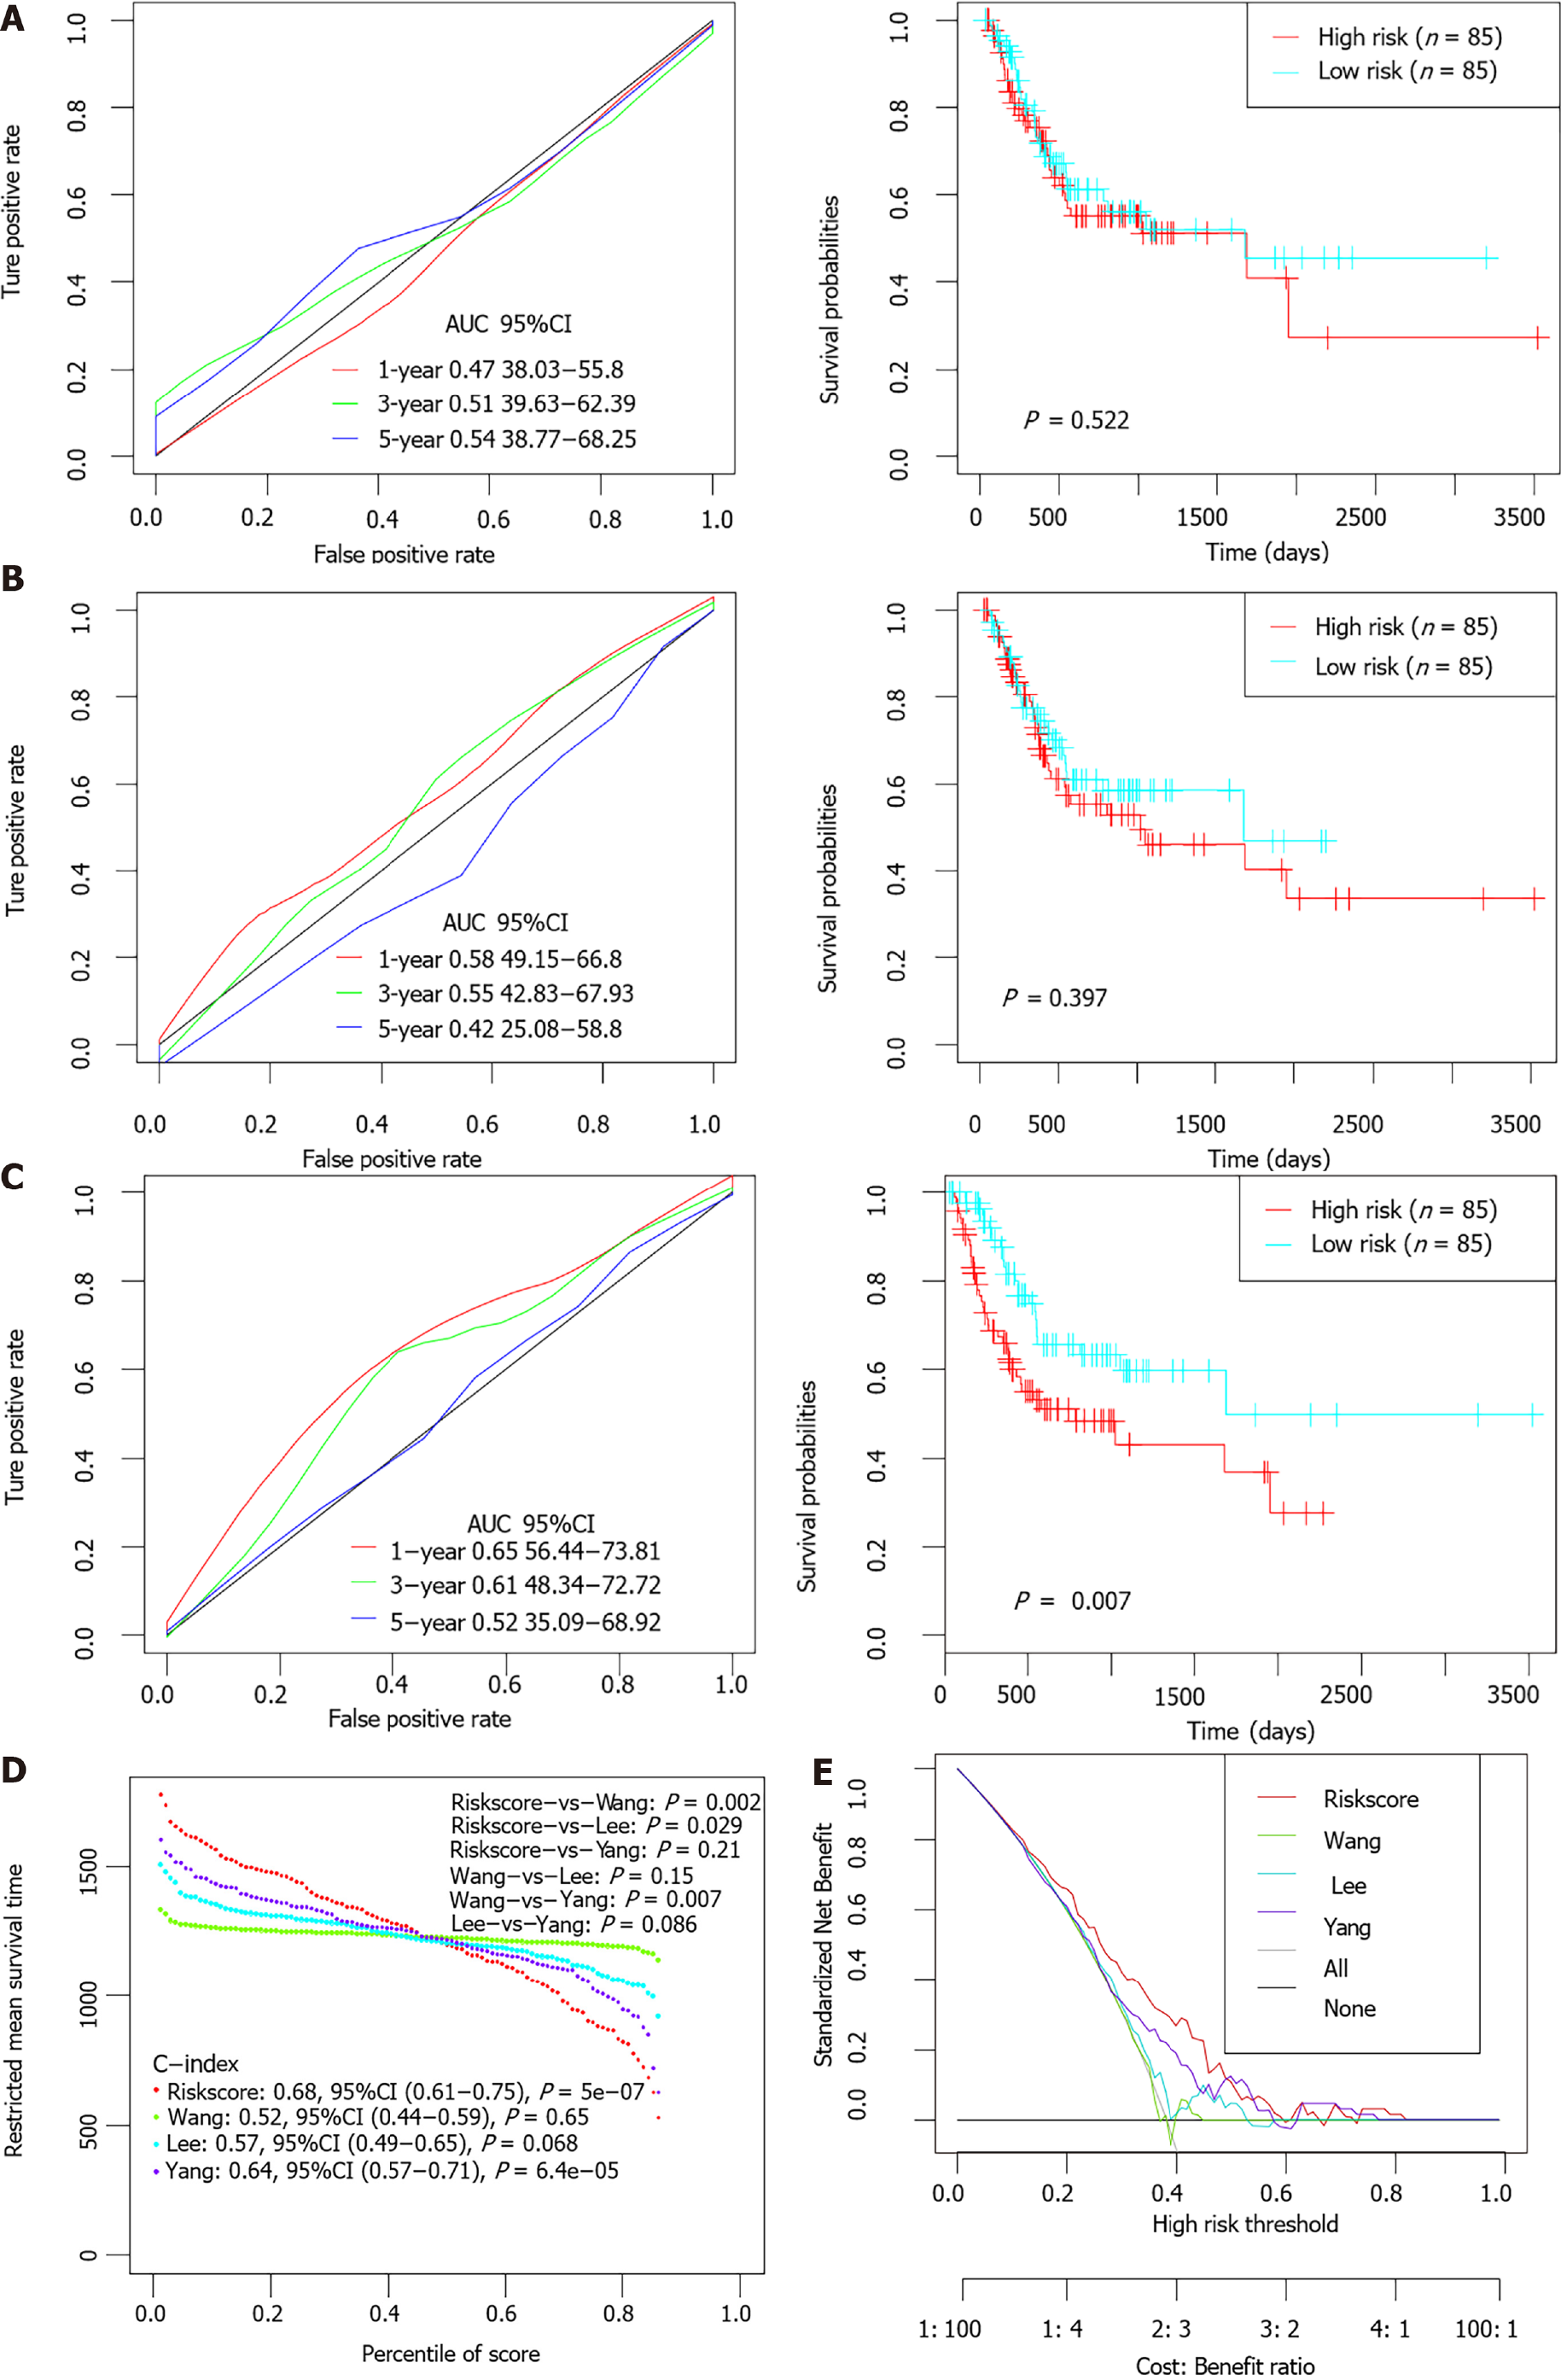
Figure 8 The performance of the 6-gene signature in comparison to previous signatures in The Cancer Genome Atlas stomach adenocarcinoma dataset.
A-C: Receiver operating characteristic (ROC) and Kaplan-Meier curves of the Wang’s (A), Lee’s (B) and Yang’s (C) gene signature for survival in The Cancer Genome Atlas stomach adenocarcinoma dataset cohort; D: Restricted mean survival time curve developed by integrating the indicated 4 signatures; E: DCA plots developed by integrating the indicated 4 signatures. AUC: Area under the curve; HR: Hazard ratio; CI: Confidence interval.
- Citation: Chang JJ, Wang XY, Zhang W, Tan C, Sheng WQ, Xu MD. Comprehensive molecular characterization and identification of prognostic signature in stomach adenocarcinoma on the basis of energy-metabolism-related genes. World J Gastrointest Oncol 2022; 14(2): 478-497
- URL: https://www.wjgnet.com/1948-5204/full/v14/i2/478.htm
- DOI: https://dx.doi.org/10.4251/wjgo.v14.i2.478


