Copyright
©The Author(s) 2022.
World J Gastrointest Oncol. Feb 15, 2022; 14(2): 478-497
Published online Feb 15, 2022. doi: 10.4251/wjgo.v14.i2.478
Published online Feb 15, 2022. doi: 10.4251/wjgo.v14.i2.478
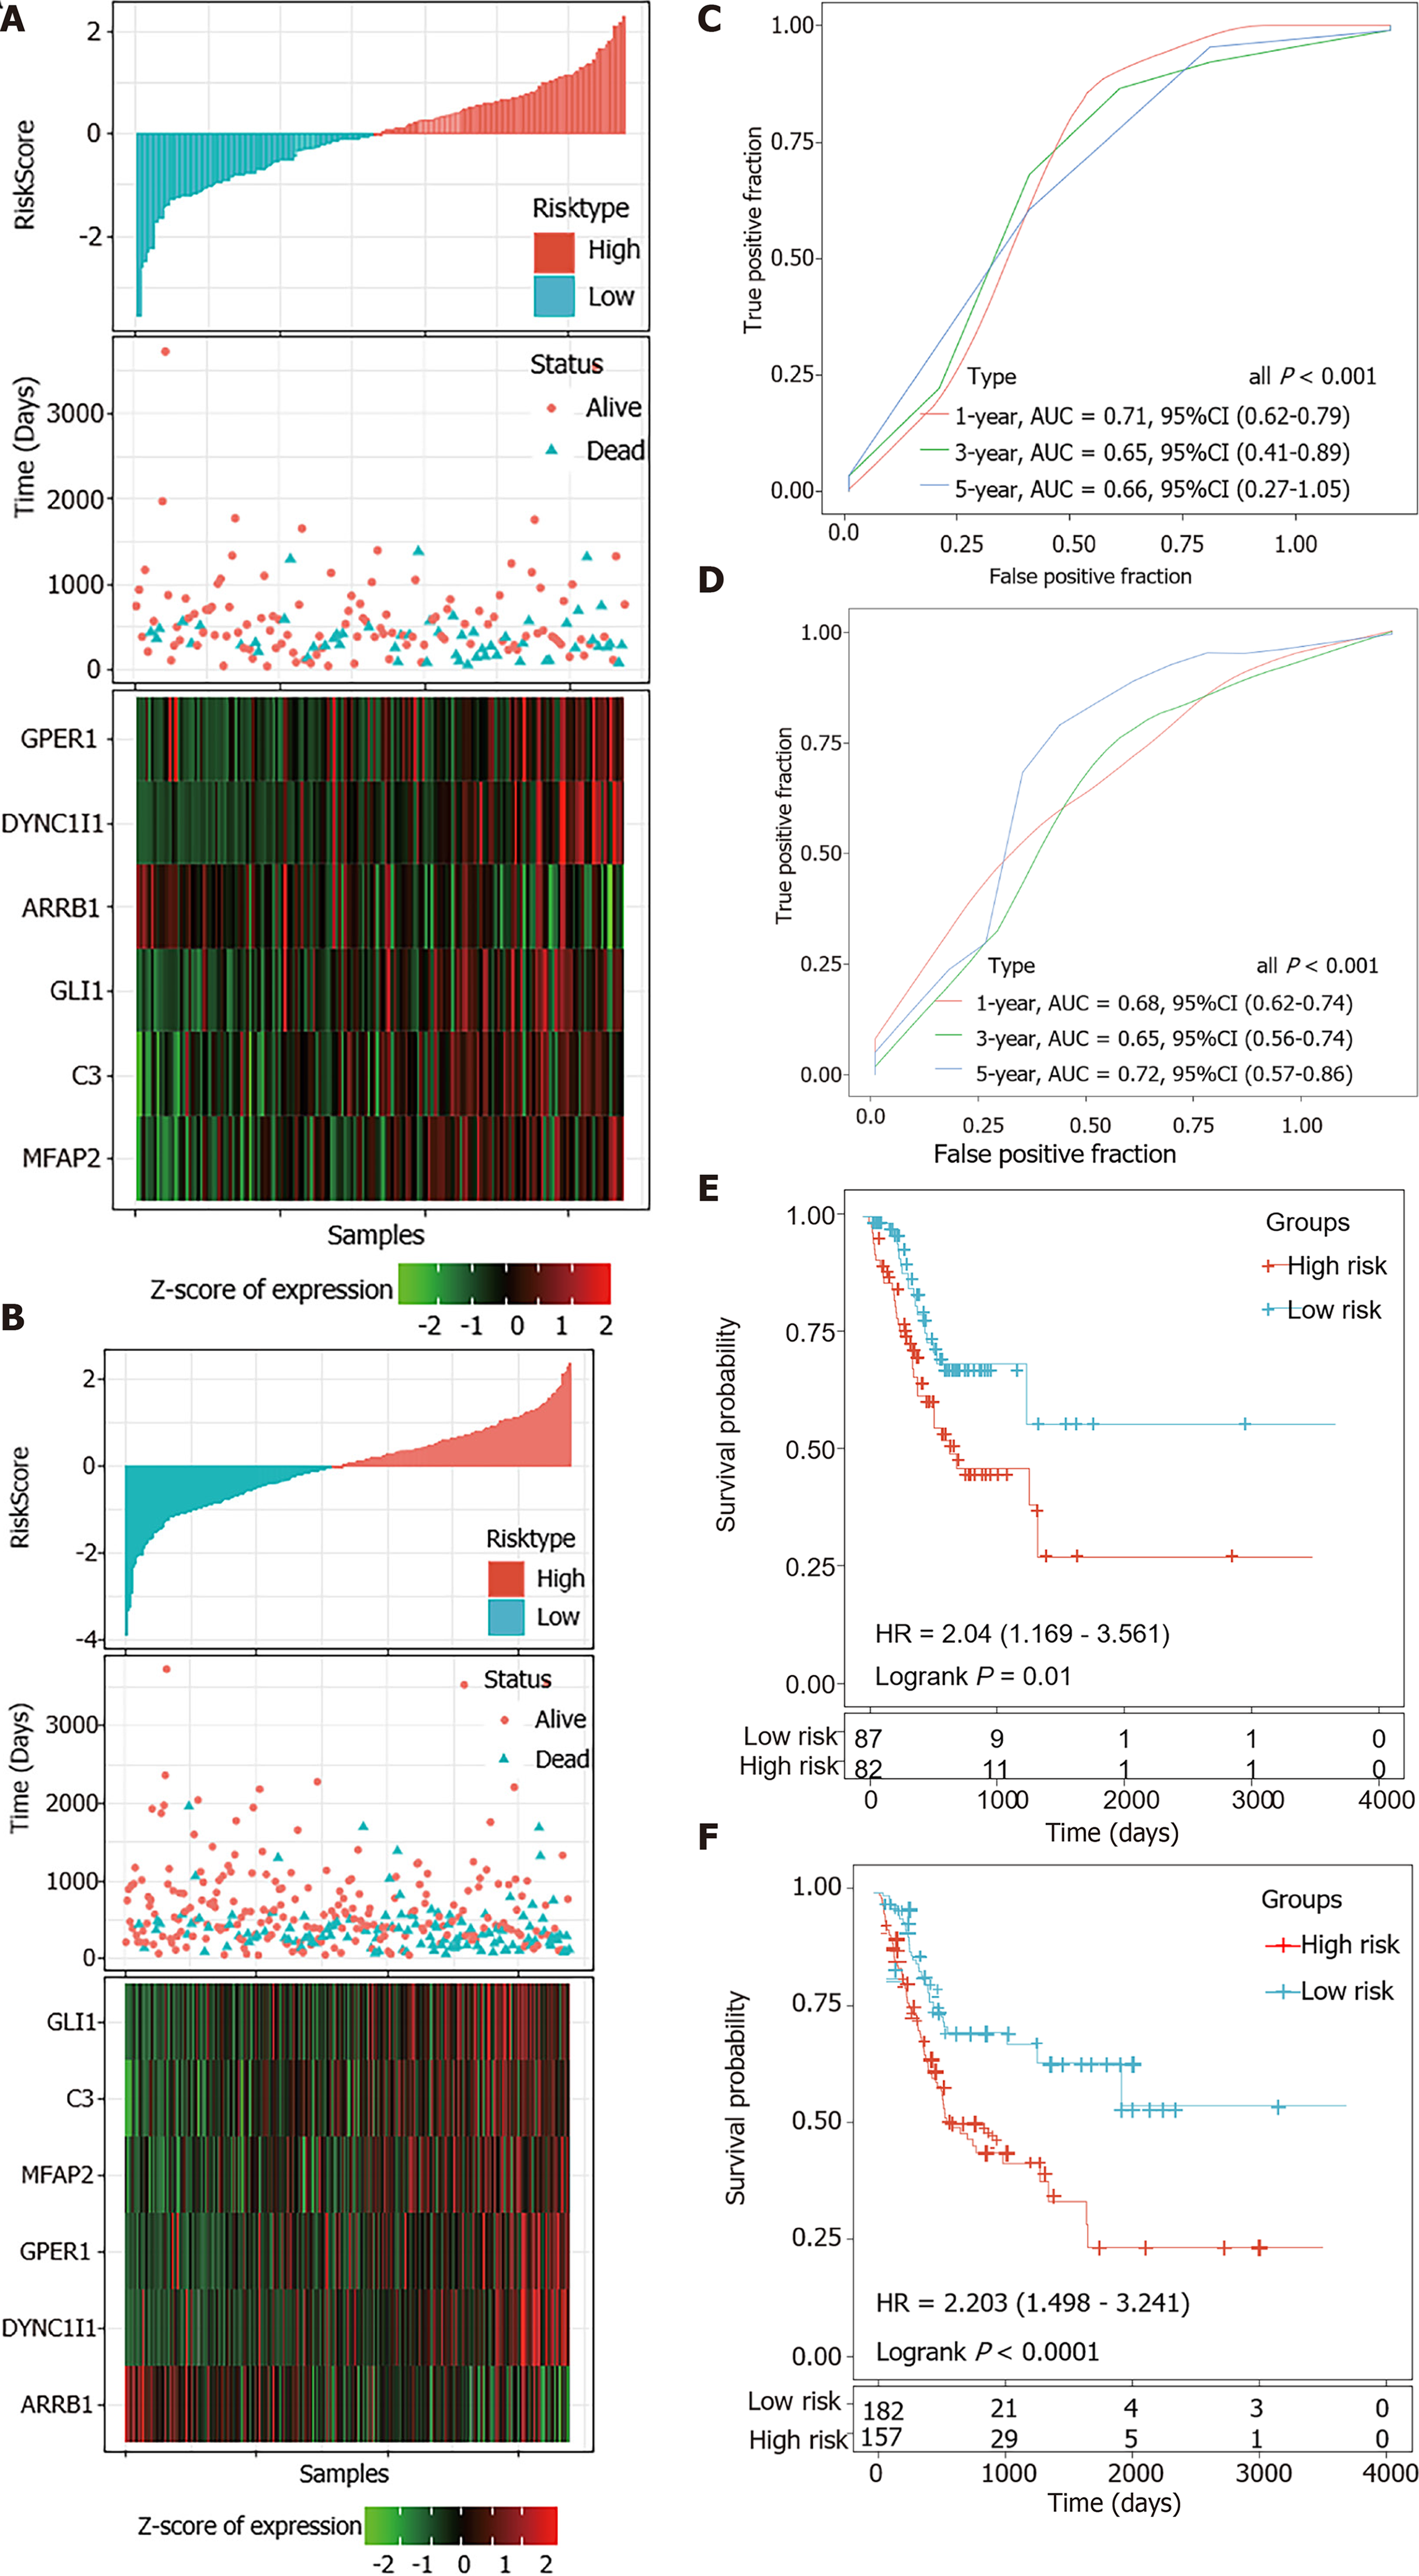
Figure 6 Internal validation of the 6-gene signature’s robustness in the internal validation set and entire The Cancer Genome Atlas cohort.
A and B: Risk score, survival time, survival status and expression of the 6-gene signature in the internal validation set (A) and the entire The Cancer Genome Atlas (TCGA) cohort (B); C and D: Receiver operating characteristic (ROC) curve of the 6-gene signature for 1-year, 3-year and 5-year survival in the internal validation set (C) and the entire TCGA cohort (D); E and F: Kaplan-Meier survival analysis of PFS for high-risk or low-risk group patients in the internal validation set (E) and the entire TCGA cohort (F). AUC: Area under the curve; HR: Hazard ratio; CI: Confidence interval.
- Citation: Chang JJ, Wang XY, Zhang W, Tan C, Sheng WQ, Xu MD. Comprehensive molecular characterization and identification of prognostic signature in stomach adenocarcinoma on the basis of energy-metabolism-related genes. World J Gastrointest Oncol 2022; 14(2): 478-497
- URL: https://www.wjgnet.com/1948-5204/full/v14/i2/478.htm
- DOI: https://dx.doi.org/10.4251/wjgo.v14.i2.478


