Copyright
©The Author(s) 2022.
World J Gastrointest Oncol. Feb 15, 2022; 14(2): 478-497
Published online Feb 15, 2022. doi: 10.4251/wjgo.v14.i2.478
Published online Feb 15, 2022. doi: 10.4251/wjgo.v14.i2.478
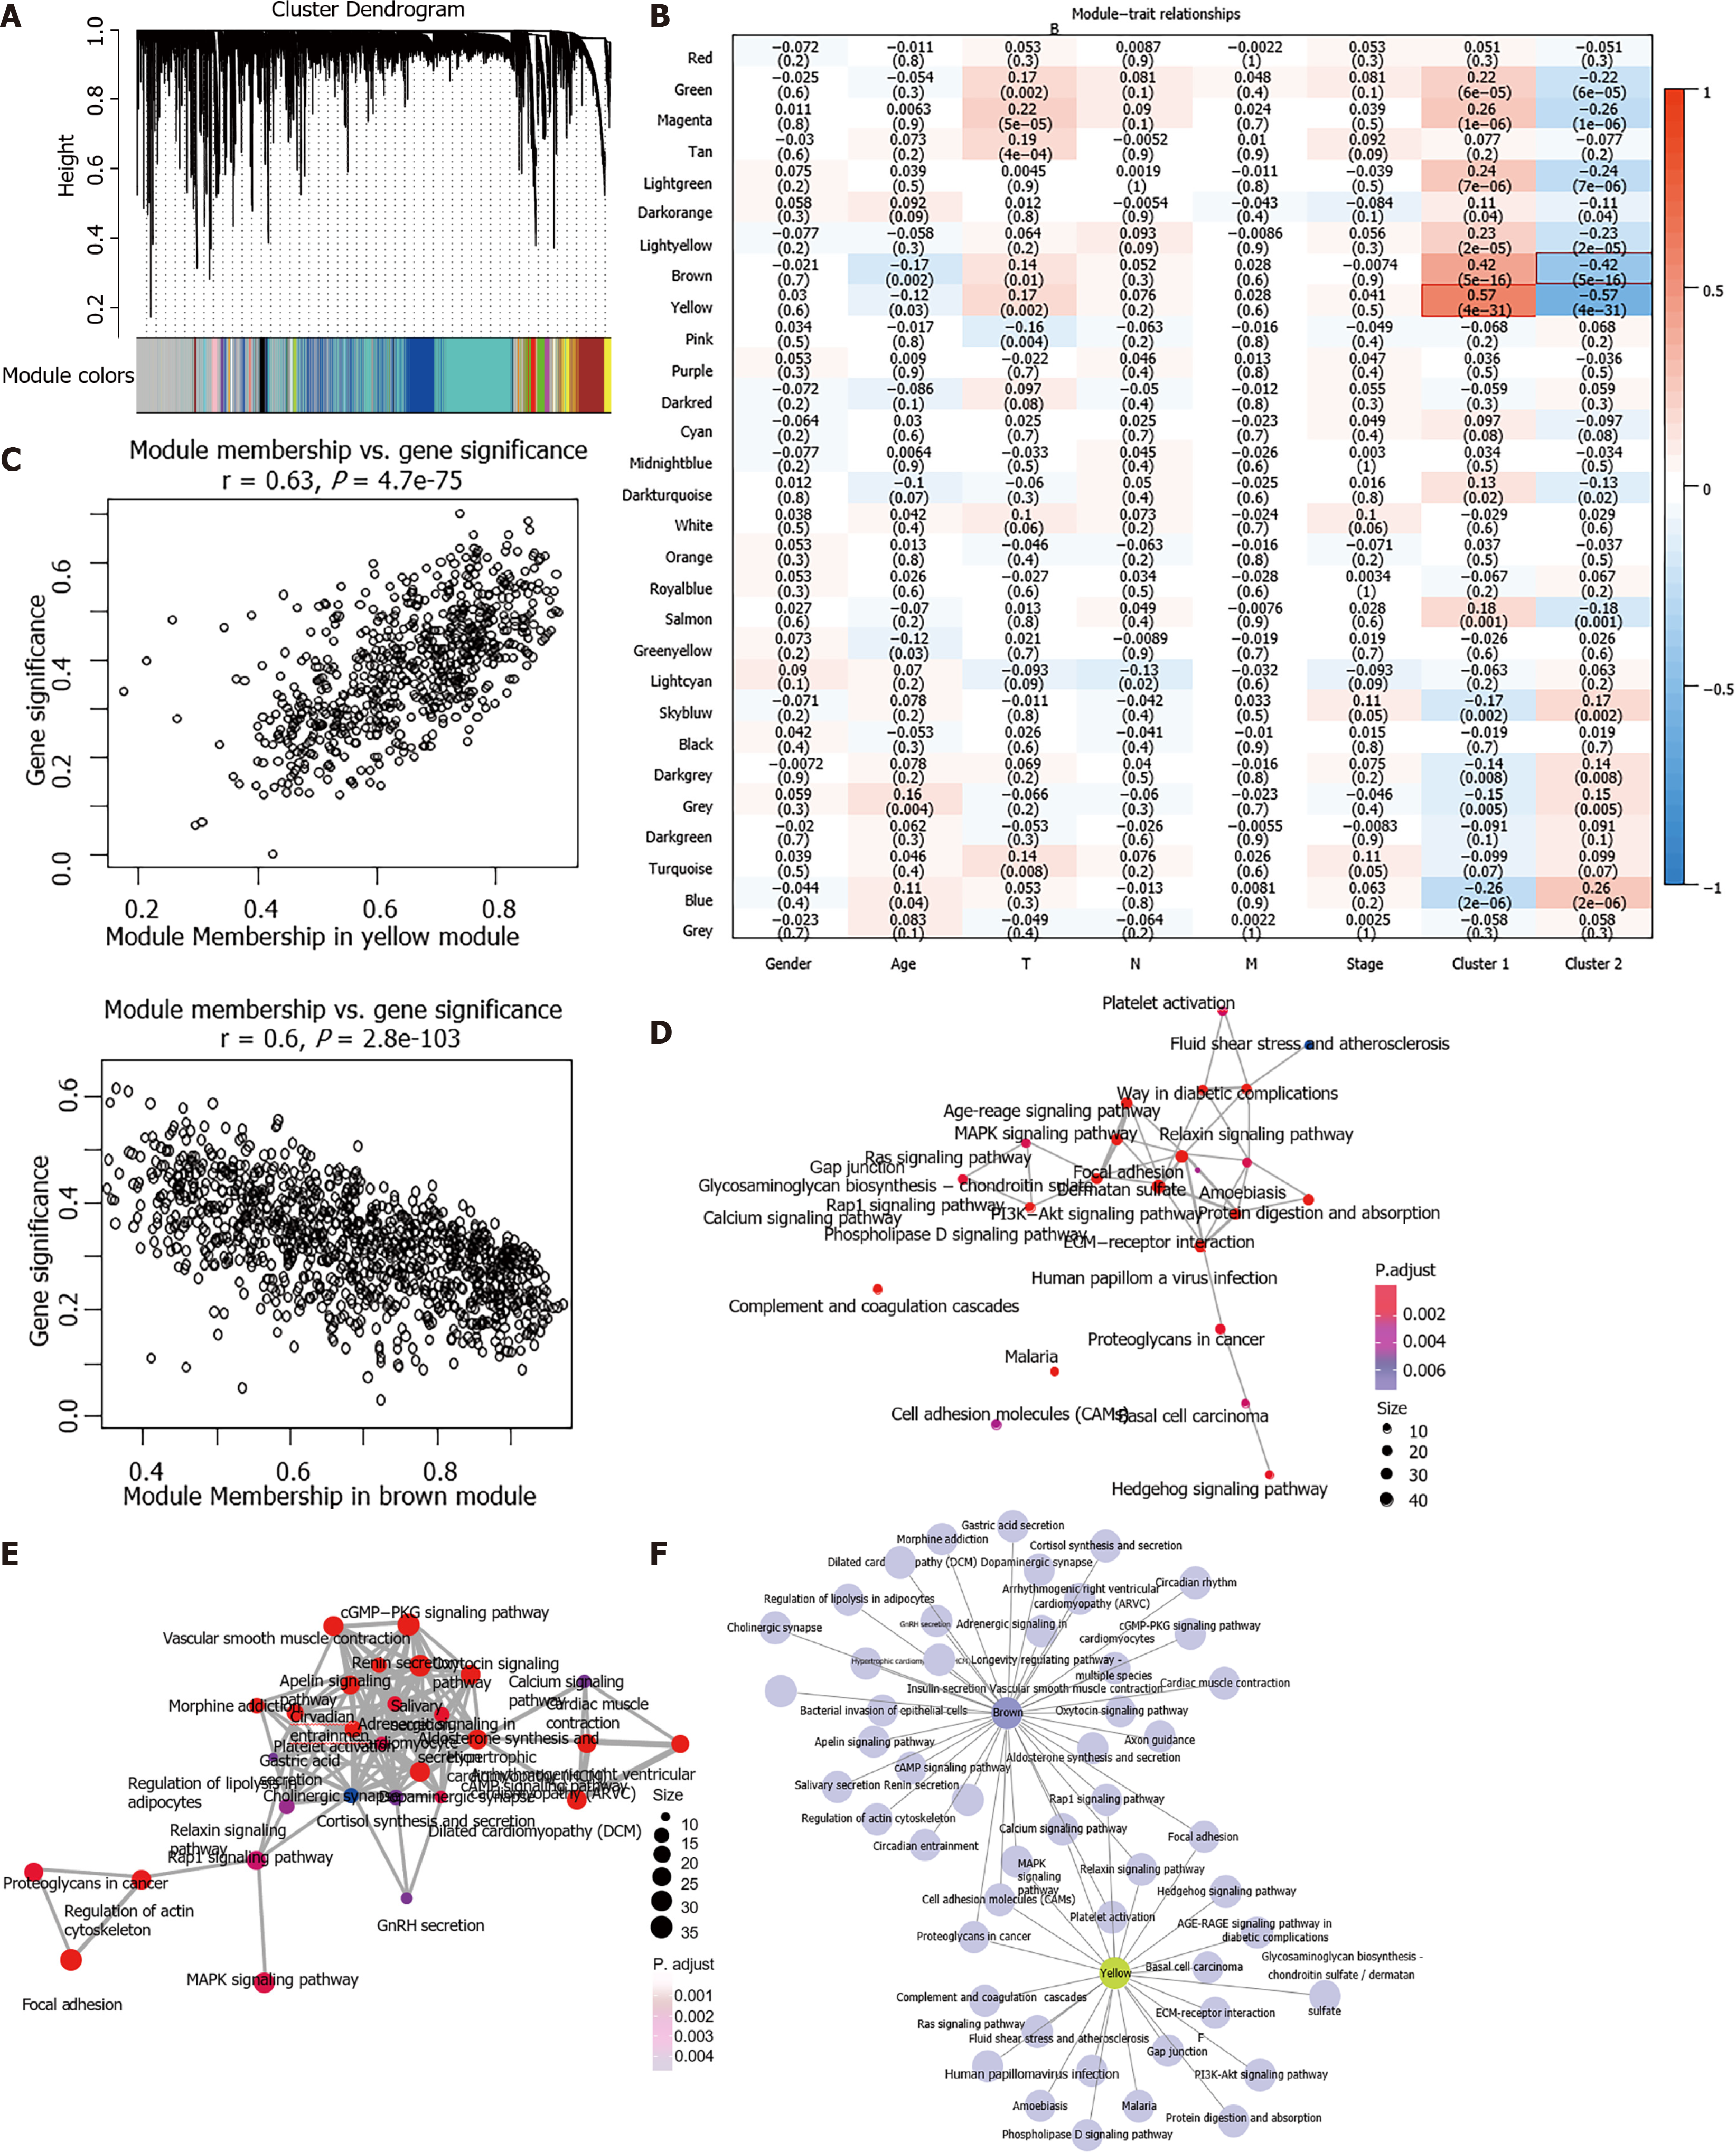
Figure 3 WGCNA co-expression analysis.
A: Gene dendrogram and module colors; B: Relationship between the 29 modules and the clinical phenotypes and molecular subtypes; C: The correlation of yellow module with Cluster 1, and brown module with Cluster 2 in The Cancer Genome Atlas dataset; D and E: Gene Kyoto Encyclopedia of Genes and Genomes enrichment functional integration network of the yellow module (D) and brown module (E); F: Network relationship between the enrichment results of the two modules. The color of the dot stands for the different P value and the size of the dot reflects the number of genes enriched in the corresponding pathway.
- Citation: Chang JJ, Wang XY, Zhang W, Tan C, Sheng WQ, Xu MD. Comprehensive molecular characterization and identification of prognostic signature in stomach adenocarcinoma on the basis of energy-metabolism-related genes. World J Gastrointest Oncol 2022; 14(2): 478-497
- URL: https://www.wjgnet.com/1948-5204/full/v14/i2/478.htm
- DOI: https://dx.doi.org/10.4251/wjgo.v14.i2.478


