Copyright
©The Author(s) 2022.
World J Gastrointest Oncol. Feb 15, 2022; 14(2): 478-497
Published online Feb 15, 2022. doi: 10.4251/wjgo.v14.i2.478
Published online Feb 15, 2022. doi: 10.4251/wjgo.v14.i2.478
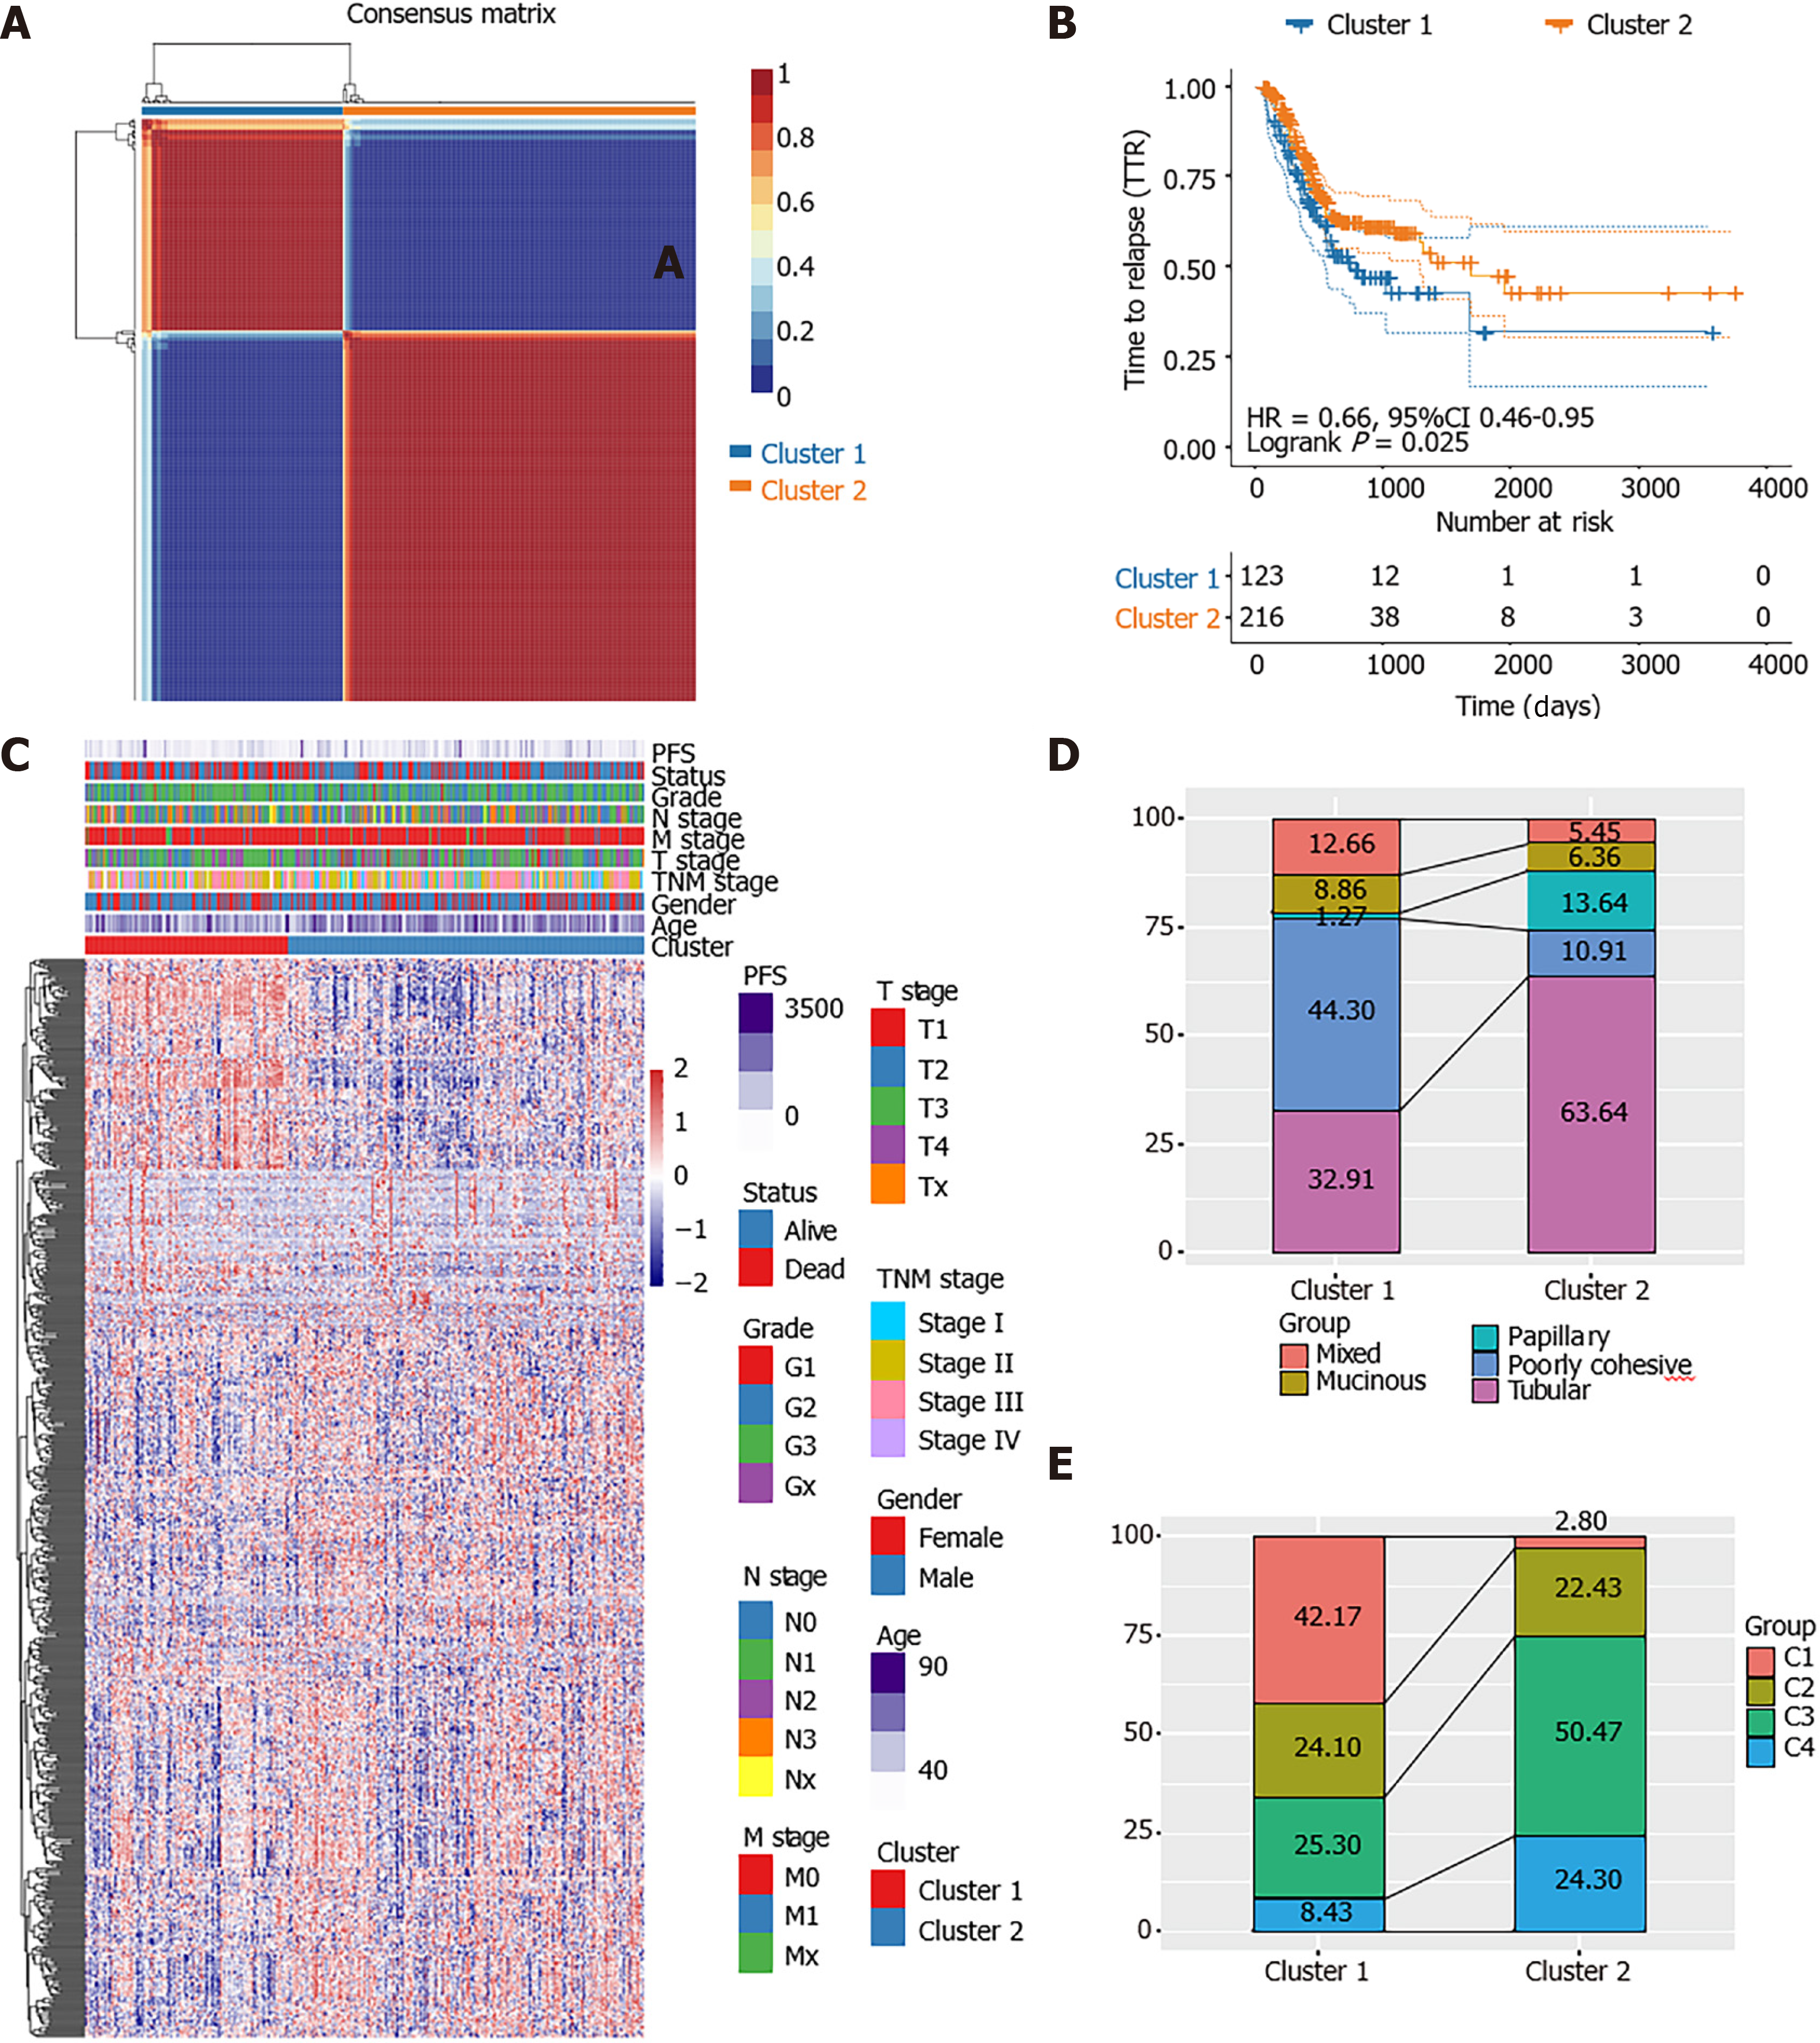
Figure 1 Identification of molecular subtypes in stomach adenocarcinoma.
A: Consensus map of non-negative matrix factorization clustering; B: Kaplan-Meier curves showed the PFS curve of the three subtypes; C: Heat map of the expression profile of 584 energy-metabolism-related genes and the distribution of clinicopathological parameters in all three subtypes; D: The alluvial diagram showed the comparison of molecular subtype with World Health Organization classification; E: The alluvial diagram showed the comparison of molecular subtype with The Cancer Genome Atlas four subtypes-classification.
- Citation: Chang JJ, Wang XY, Zhang W, Tan C, Sheng WQ, Xu MD. Comprehensive molecular characterization and identification of prognostic signature in stomach adenocarcinoma on the basis of energy-metabolism-related genes. World J Gastrointest Oncol 2022; 14(2): 478-497
- URL: https://www.wjgnet.com/1948-5204/full/v14/i2/478.htm
- DOI: https://dx.doi.org/10.4251/wjgo.v14.i2.478


