Copyright
©The Author(s) 2022.
World J Gastrointest Oncol. Feb 15, 2022; 14(2): 450-477
Published online Feb 15, 2022. doi: 10.4251/wjgo.v14.i2.450
Published online Feb 15, 2022. doi: 10.4251/wjgo.v14.i2.450
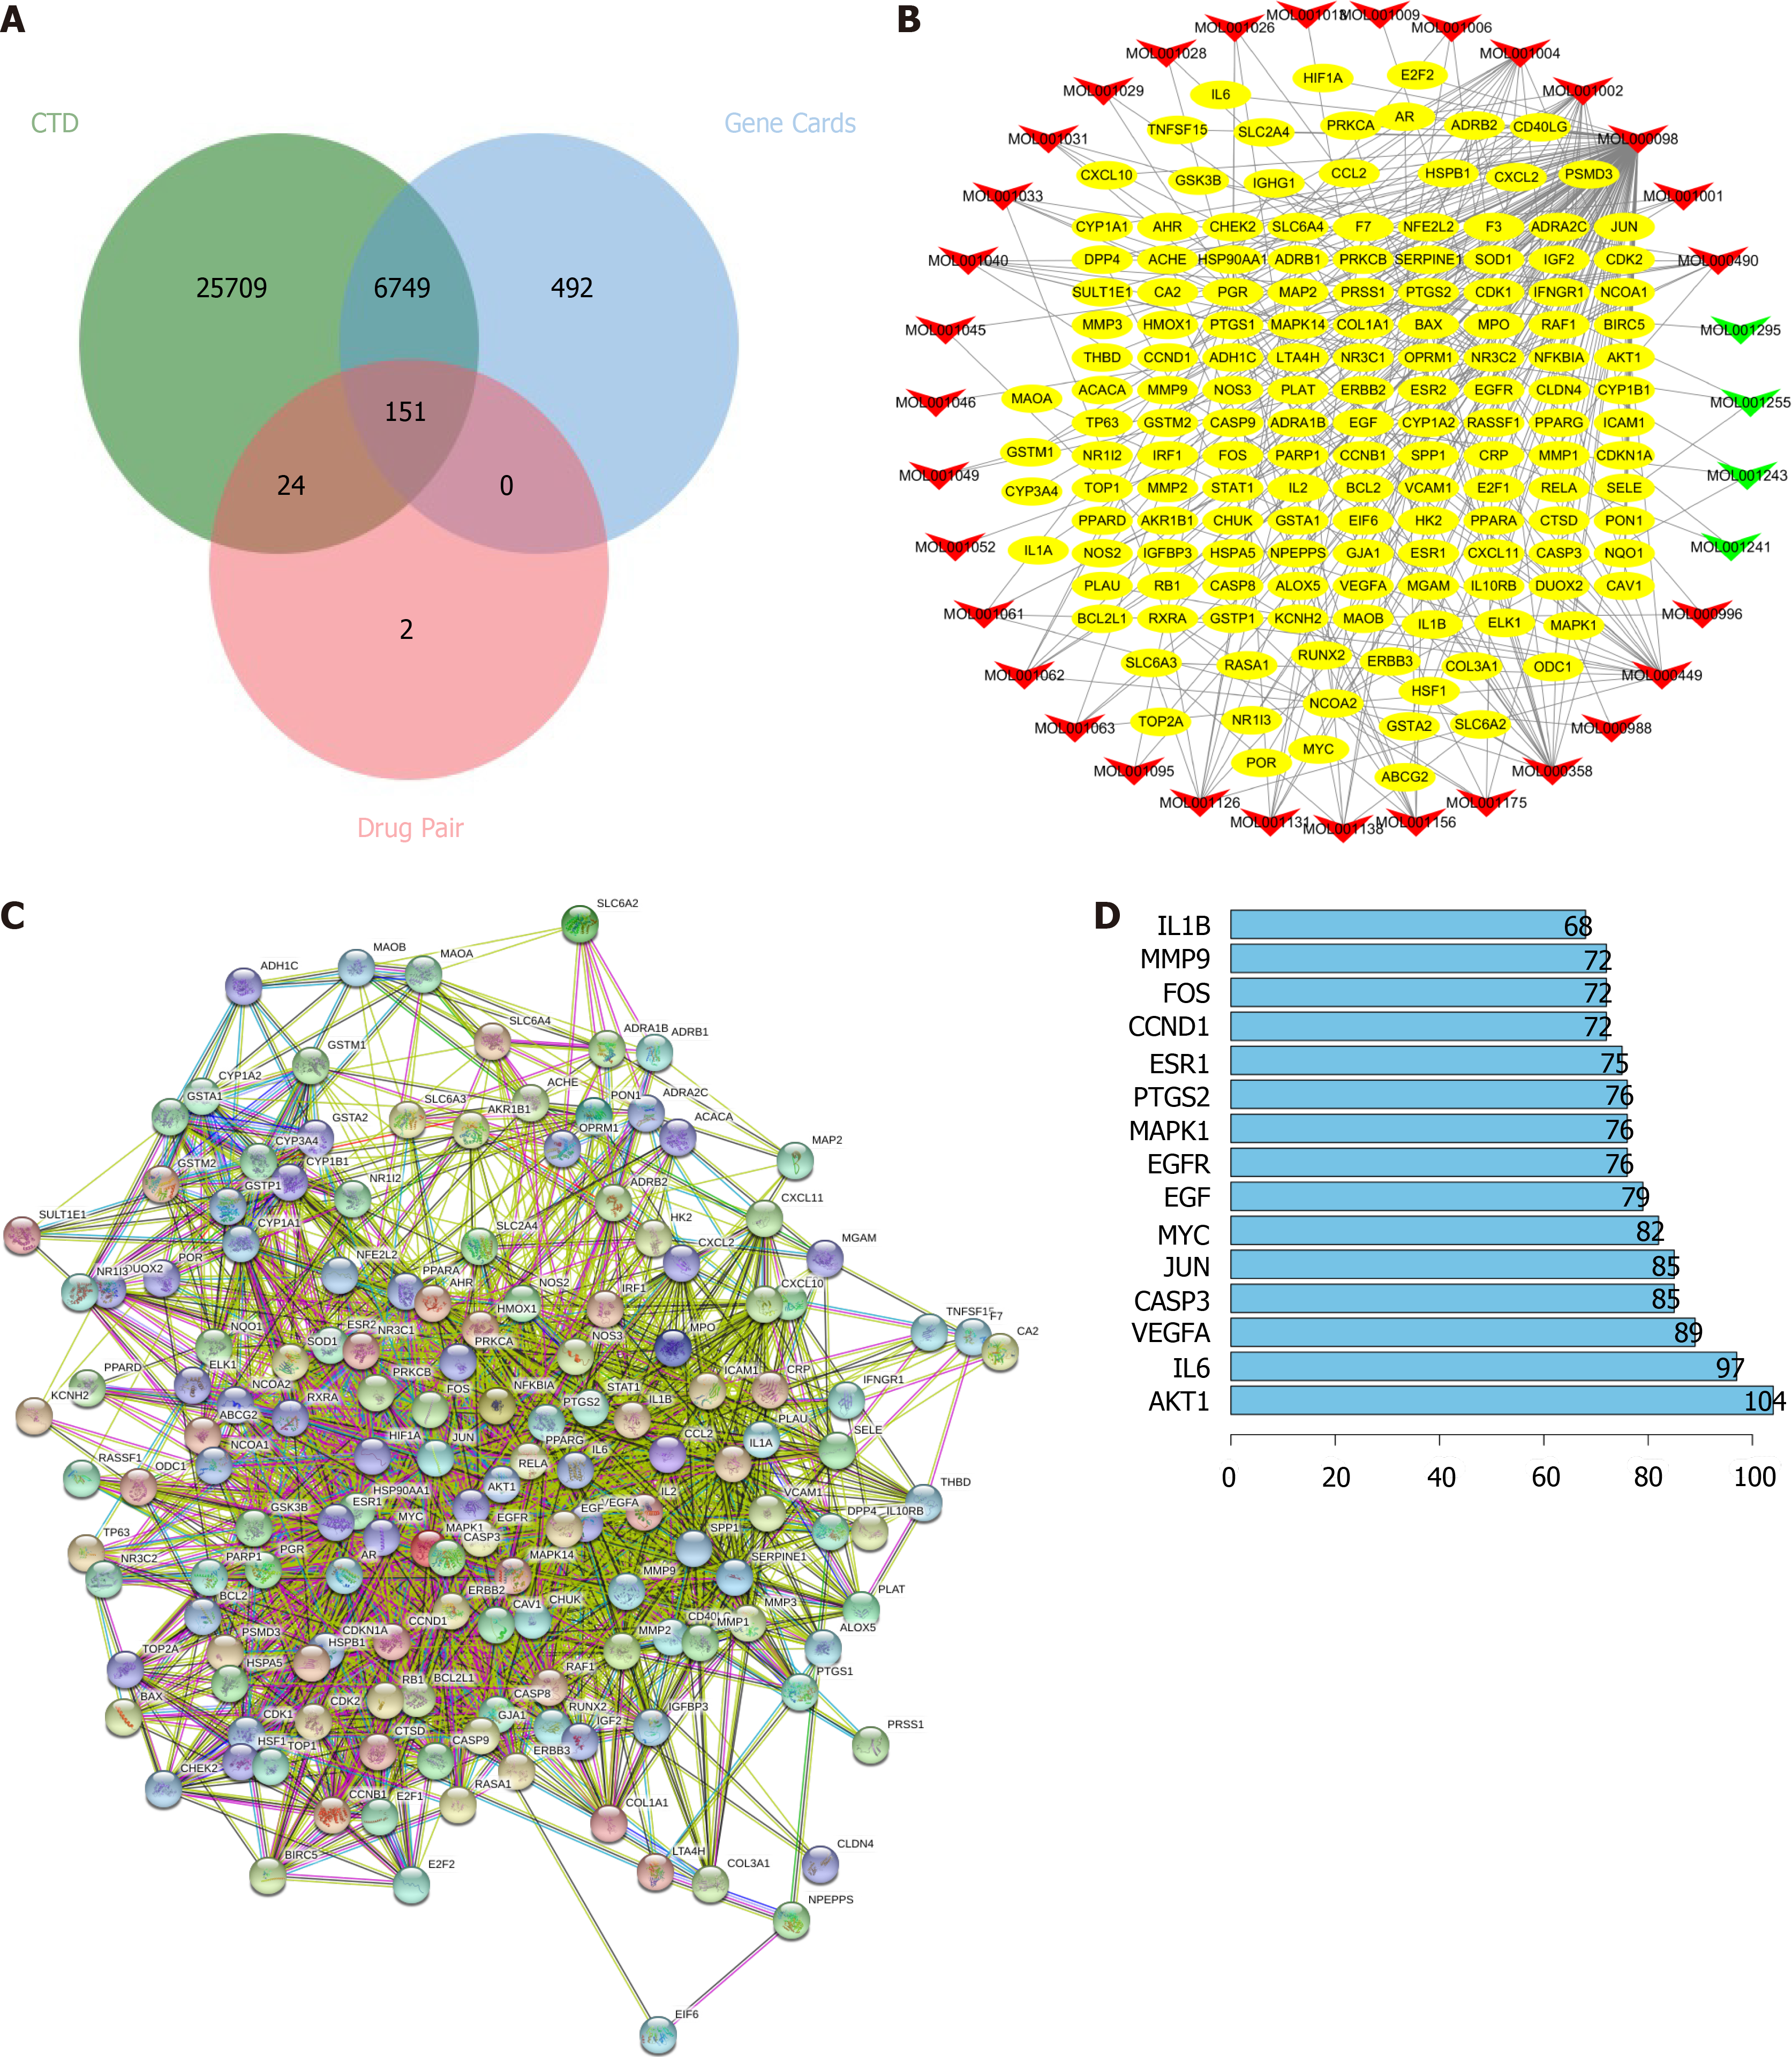
Figure 1 Active component target network and protein-protein interaction network of frankincense and myrrh in the treatment of hepatocellular carcinoma.
A: Wayne diagram of the targets; B: Compound-target network. Yellow oval node represents the key target, the green node represents the active ingredient of frankincense, and the red node represents the active ingredient of myrrh, The edges represent the interactions between them; C: Protein-protein interaction network. Circular nodes represent targets and edges represent interactions; D: The bar chart of the sorting of the core target. The abscissa represents the number of nodes, and the ordinate is the name of the core target.
- Citation: Zheng P, Huang Z, Tong DC, Zhou Q, Tian S, Chen BW, Ning DM, Guo YM, Zhu WH, Long Y, Xiao W, Deng Z, Lei YC, Tian XF. Frankincense myrrh attenuates hepatocellular carcinoma by regulating tumor blood vessel development through multiple epidermal growth factor receptor-mediated signaling pathways. World J Gastrointest Oncol 2022; 14(2): 450-477
- URL: https://www.wjgnet.com/1948-5204/full/v14/i2/450.htm
- DOI: https://dx.doi.org/10.4251/wjgo.v14.i2.450


