Copyright
©The Author(s) 2022.
World J Gastrointest Oncol. Dec 15, 2022; 14(12): 2313-2328
Published online Dec 15, 2022. doi: 10.4251/wjgo.v14.i12.2313
Published online Dec 15, 2022. doi: 10.4251/wjgo.v14.i12.2313
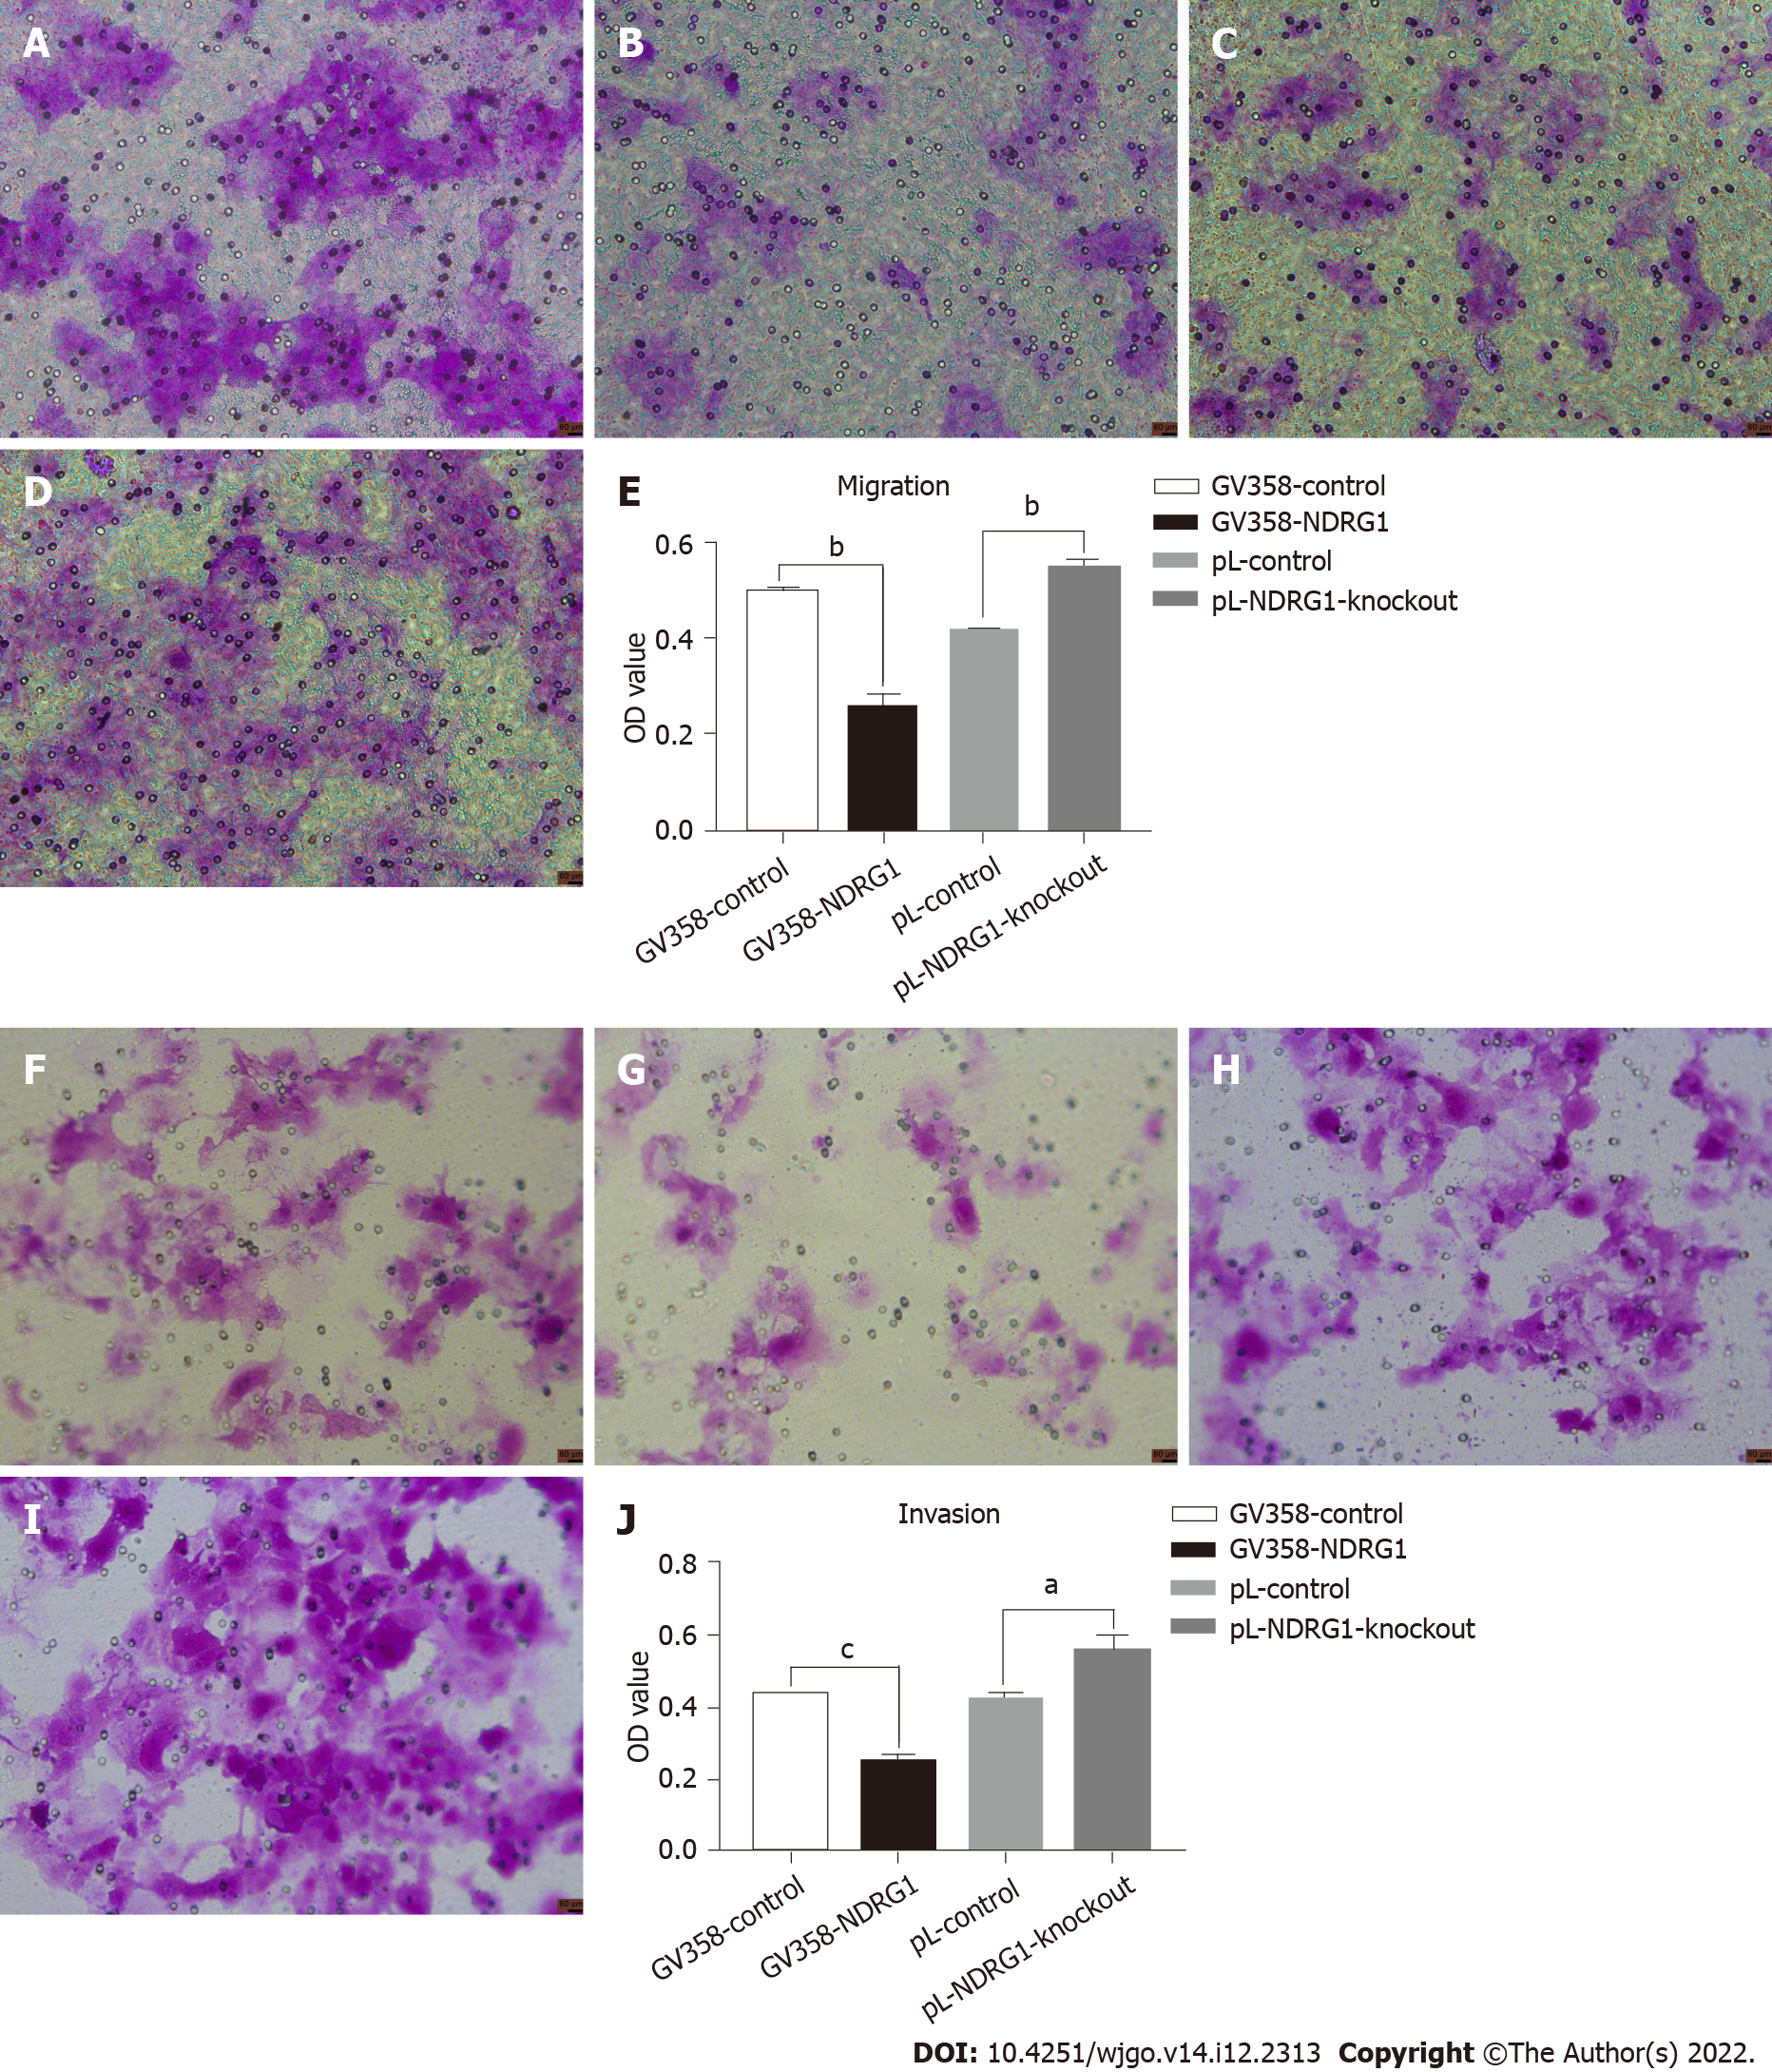
Figure 7 N-myc downstream regulated gene 1 inhibited migration and invasion of Caco2 cells.
24-well transwell chambers were used to detect migration and invasion. Cells were stained with crystal violet, eluted with 33% acetic acid, and the absorbance of the eluate was measured at 570 nm. The number of cells passing through the chamber at 48 h of the migration experiment (A-E). The number of cells passing through the chamber at 48 h of the invasion experiment (F-J). A: Number of cells passing through the chamber at 48 h of migration assay in GV358-control group (Scale bar: 60 μm); B: Number of cells passing through the chamber at 48 h of migration assay in GV358-N-myc downstream regulated gene 1 (NDRG1)-over-expression group (Scale bar: 60 μm); C: Number of cells passing through the chamber at 48 h of migration assay in pL-control group (Scale bar: 60 μm); D: Number of cells passing through the chamber at 48 h of migration assay in pL-NDRG1-knockout group (Scale bar: 60 μm); E: Statistical histograms of OD values eluted by crystal violet after NDRG1 over-expression and knockdown at 48h of migration assay; F: Number of cells passing through the chamber at 48 h of invasion assay in GV358-control group (Scale bar: 60 μm); G: Number of cells passing through the chamber at 48 h of invasion assay in GV358-NDRG1-over-expression group (Scale bar: 60 μm); H: Number of cells passing through the chamber at 48 h of invasion assay in pL-control group (Scale bar: 60 μm); I: Number of cells passing through the chamber at 48 h of invasion assay in pL-NDRG1-knockout group (Scale bar: 60 μm); J: Statistical histograms of OD values eluted by crystal violet after NDRG1 over-expression and knockdown at 48h of invasion assay. aP < 0.05, bP < 0.01, cP < 0.001 vs control. Experiments were repeated three times.
- Citation: He YX, Shen H, Ji YZ, Hua HR, Zhu Y, Zeng XF, Wang F, Wang KX. N-myc downstream regulated gene 1 inhibition of tumor progression in Caco2 cells. World J Gastrointest Oncol 2022; 14(12): 2313-2328
- URL: https://www.wjgnet.com/1948-5204/full/v14/i12/2313.htm
- DOI: https://dx.doi.org/10.4251/wjgo.v14.i12.2313


