Copyright
©The Author(s) 2022.
World J Gastrointest Oncol. Dec 15, 2022; 14(12): 2313-2328
Published online Dec 15, 2022. doi: 10.4251/wjgo.v14.i12.2313
Published online Dec 15, 2022. doi: 10.4251/wjgo.v14.i12.2313
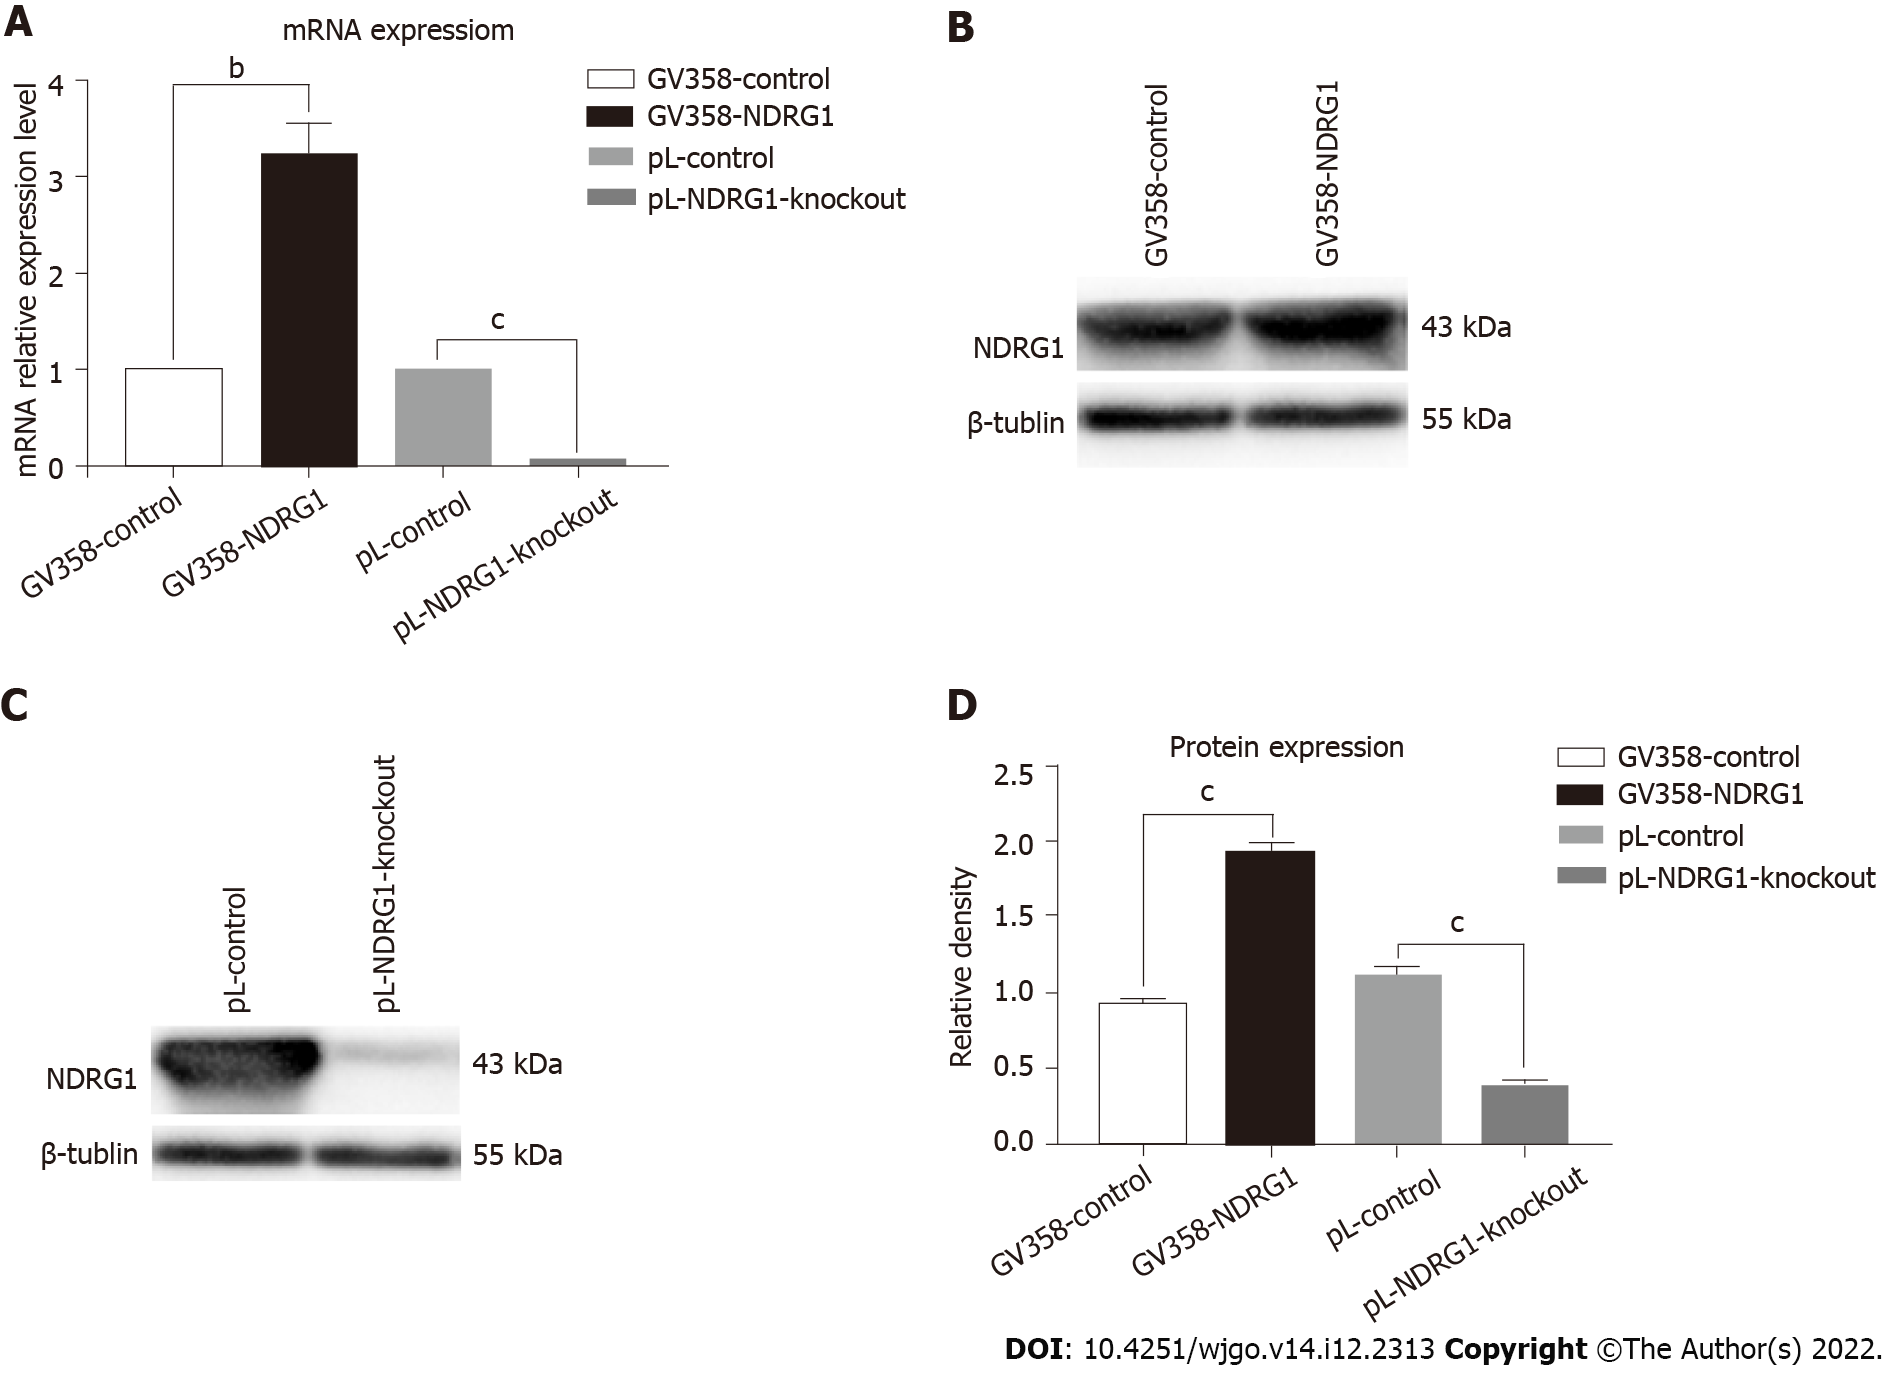
Figure 4 The results of quantitative polymerase chain reaction and western blotting after N-myc downstream regulated gene 1 over-expression and knockout.
A: The mRNA levels of N-myc downstream regulated gene 1 (NDRG1) were detected using real-time polymerase chain reaction. The relative levels of NDRG1 mRNA were calculated using the ΔΔCt method, and normalized to GAPDH expression; B-D: Representative western blot bands and statistical results of NDRG1 protein expression normalized to β-tubulin. aP < 0.05, bP < 0.01, cP < 0.001 vs control cells. Experiments were repeated three times.
- Citation: He YX, Shen H, Ji YZ, Hua HR, Zhu Y, Zeng XF, Wang F, Wang KX. N-myc downstream regulated gene 1 inhibition of tumor progression in Caco2 cells. World J Gastrointest Oncol 2022; 14(12): 2313-2328
- URL: https://www.wjgnet.com/1948-5204/full/v14/i12/2313.htm
- DOI: https://dx.doi.org/10.4251/wjgo.v14.i12.2313


