Copyright
©The Author(s) 2022.
World J Gastrointest Oncol. Nov 15, 2022; 14(11): 2108-2121
Published online Nov 15, 2022. doi: 10.4251/wjgo.v14.i11.2108
Published online Nov 15, 2022. doi: 10.4251/wjgo.v14.i11.2108
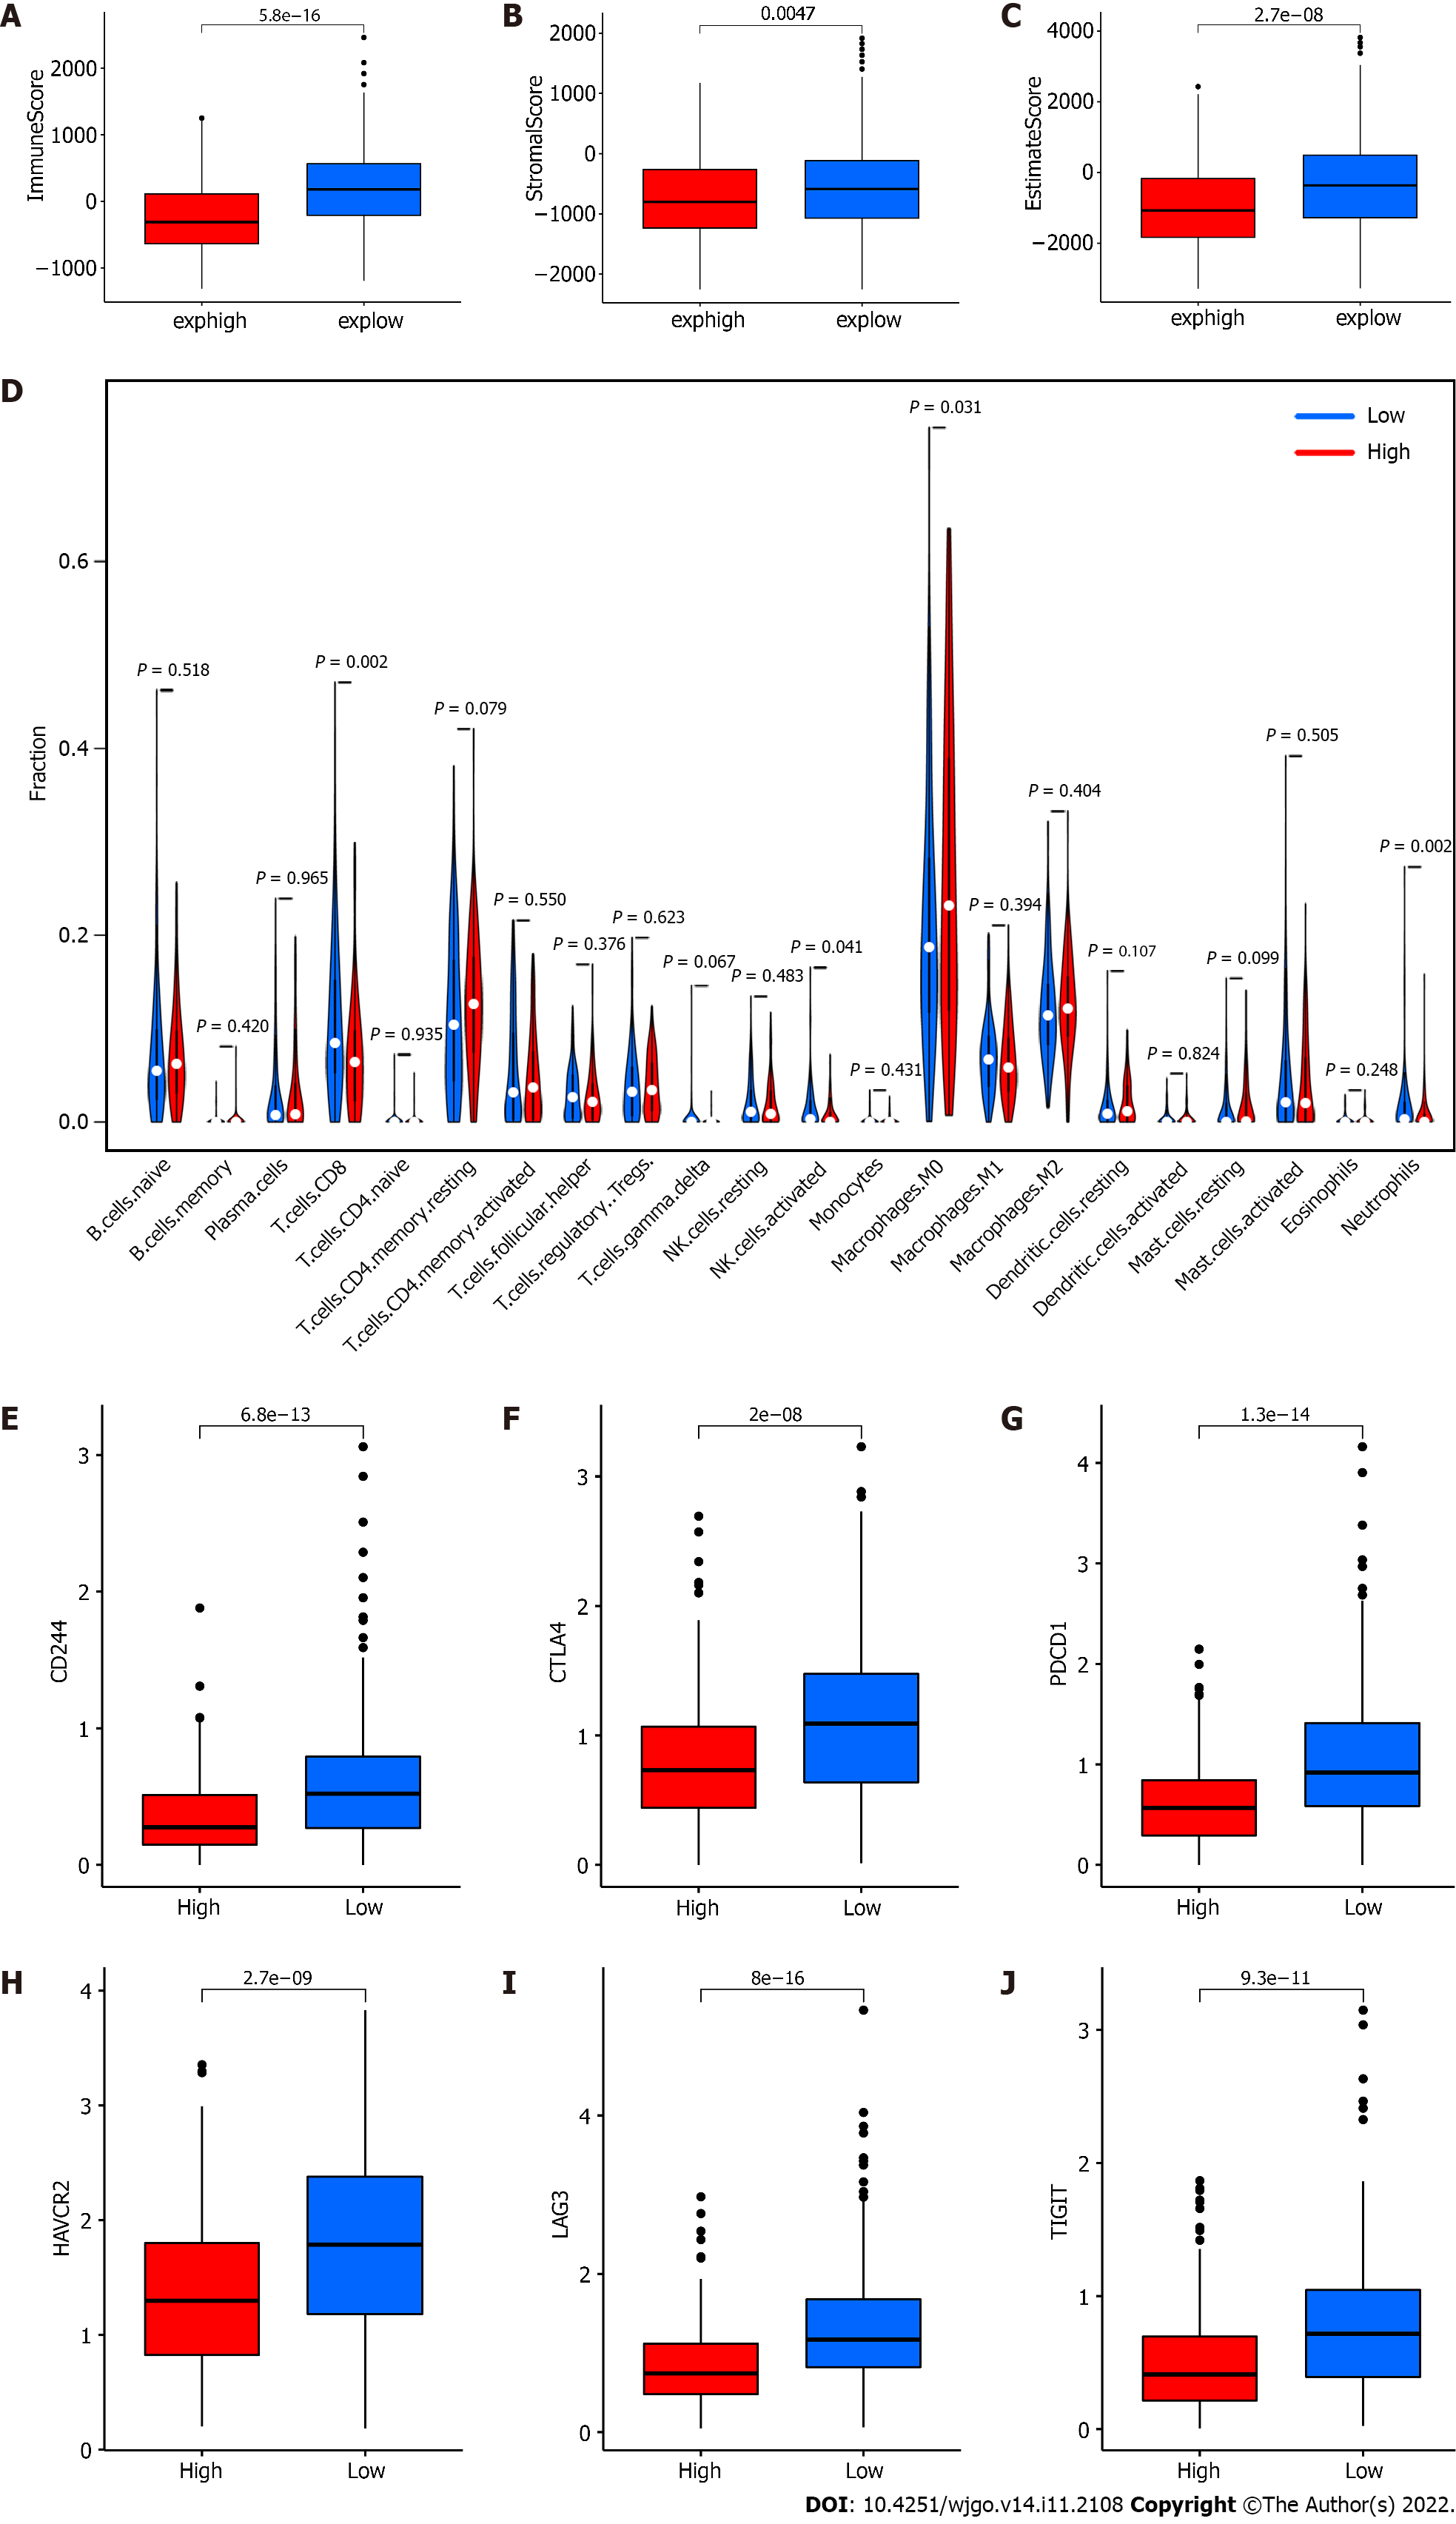
Figure 3 Distribution of tumor microenvironment scores, 22 types of immune cells and expression of T lymphocyte coinhibitory receptor genes between different groups.
A: ImmuneScore, P = 5.8 × 10⁻¹⁶; B: StromalScore, P = 0.0047; C: EstimateScore, P = 2.7 × 10⁻⁸; D: The 22 immune cell types were represented in columns, and the proportions of immune cells were represented in rows; E: Expression of CD244, P = 6.8 × 10⁻¹³; F: Expression of CTLA4, P = 2.0 × 10⁻⁸; G: Expression of PDCD1, P = 1.3 × 10⁻¹⁴; H: Expression of HAVCR2, P = 2.7 × 10⁻⁹; I: Expression of LAG3, P = 8.0 × 10⁻¹⁶; J: Expression of TIGIT, P = 9.3 × 10⁻¹¹. Red referred to the high expression group, and blue referred to the low expression group (grouped by median of RP5-881L22.5 expression). NK: Natural killer; exphigh: Expression high; explow: Expression low.
- Citation: Zong H, Zou JQ, Huang JP, Huang ST. Potential role of long noncoding RNA RP5-881L22.5 as a novel biomarker and therapeutic target of colorectal cancer. World J Gastrointest Oncol 2022; 14(11): 2108-2121
- URL: https://www.wjgnet.com/1948-5204/full/v14/i11/2108.htm
- DOI: https://dx.doi.org/10.4251/wjgo.v14.i11.2108


