Copyright
©The Author(s) 2022.
World J Gastrointest Oncol. Jan 15, 2022; 14(1): 319-333
Published online Jan 15, 2022. doi: 10.4251/wjgo.v14.i1.319
Published online Jan 15, 2022. doi: 10.4251/wjgo.v14.i1.319
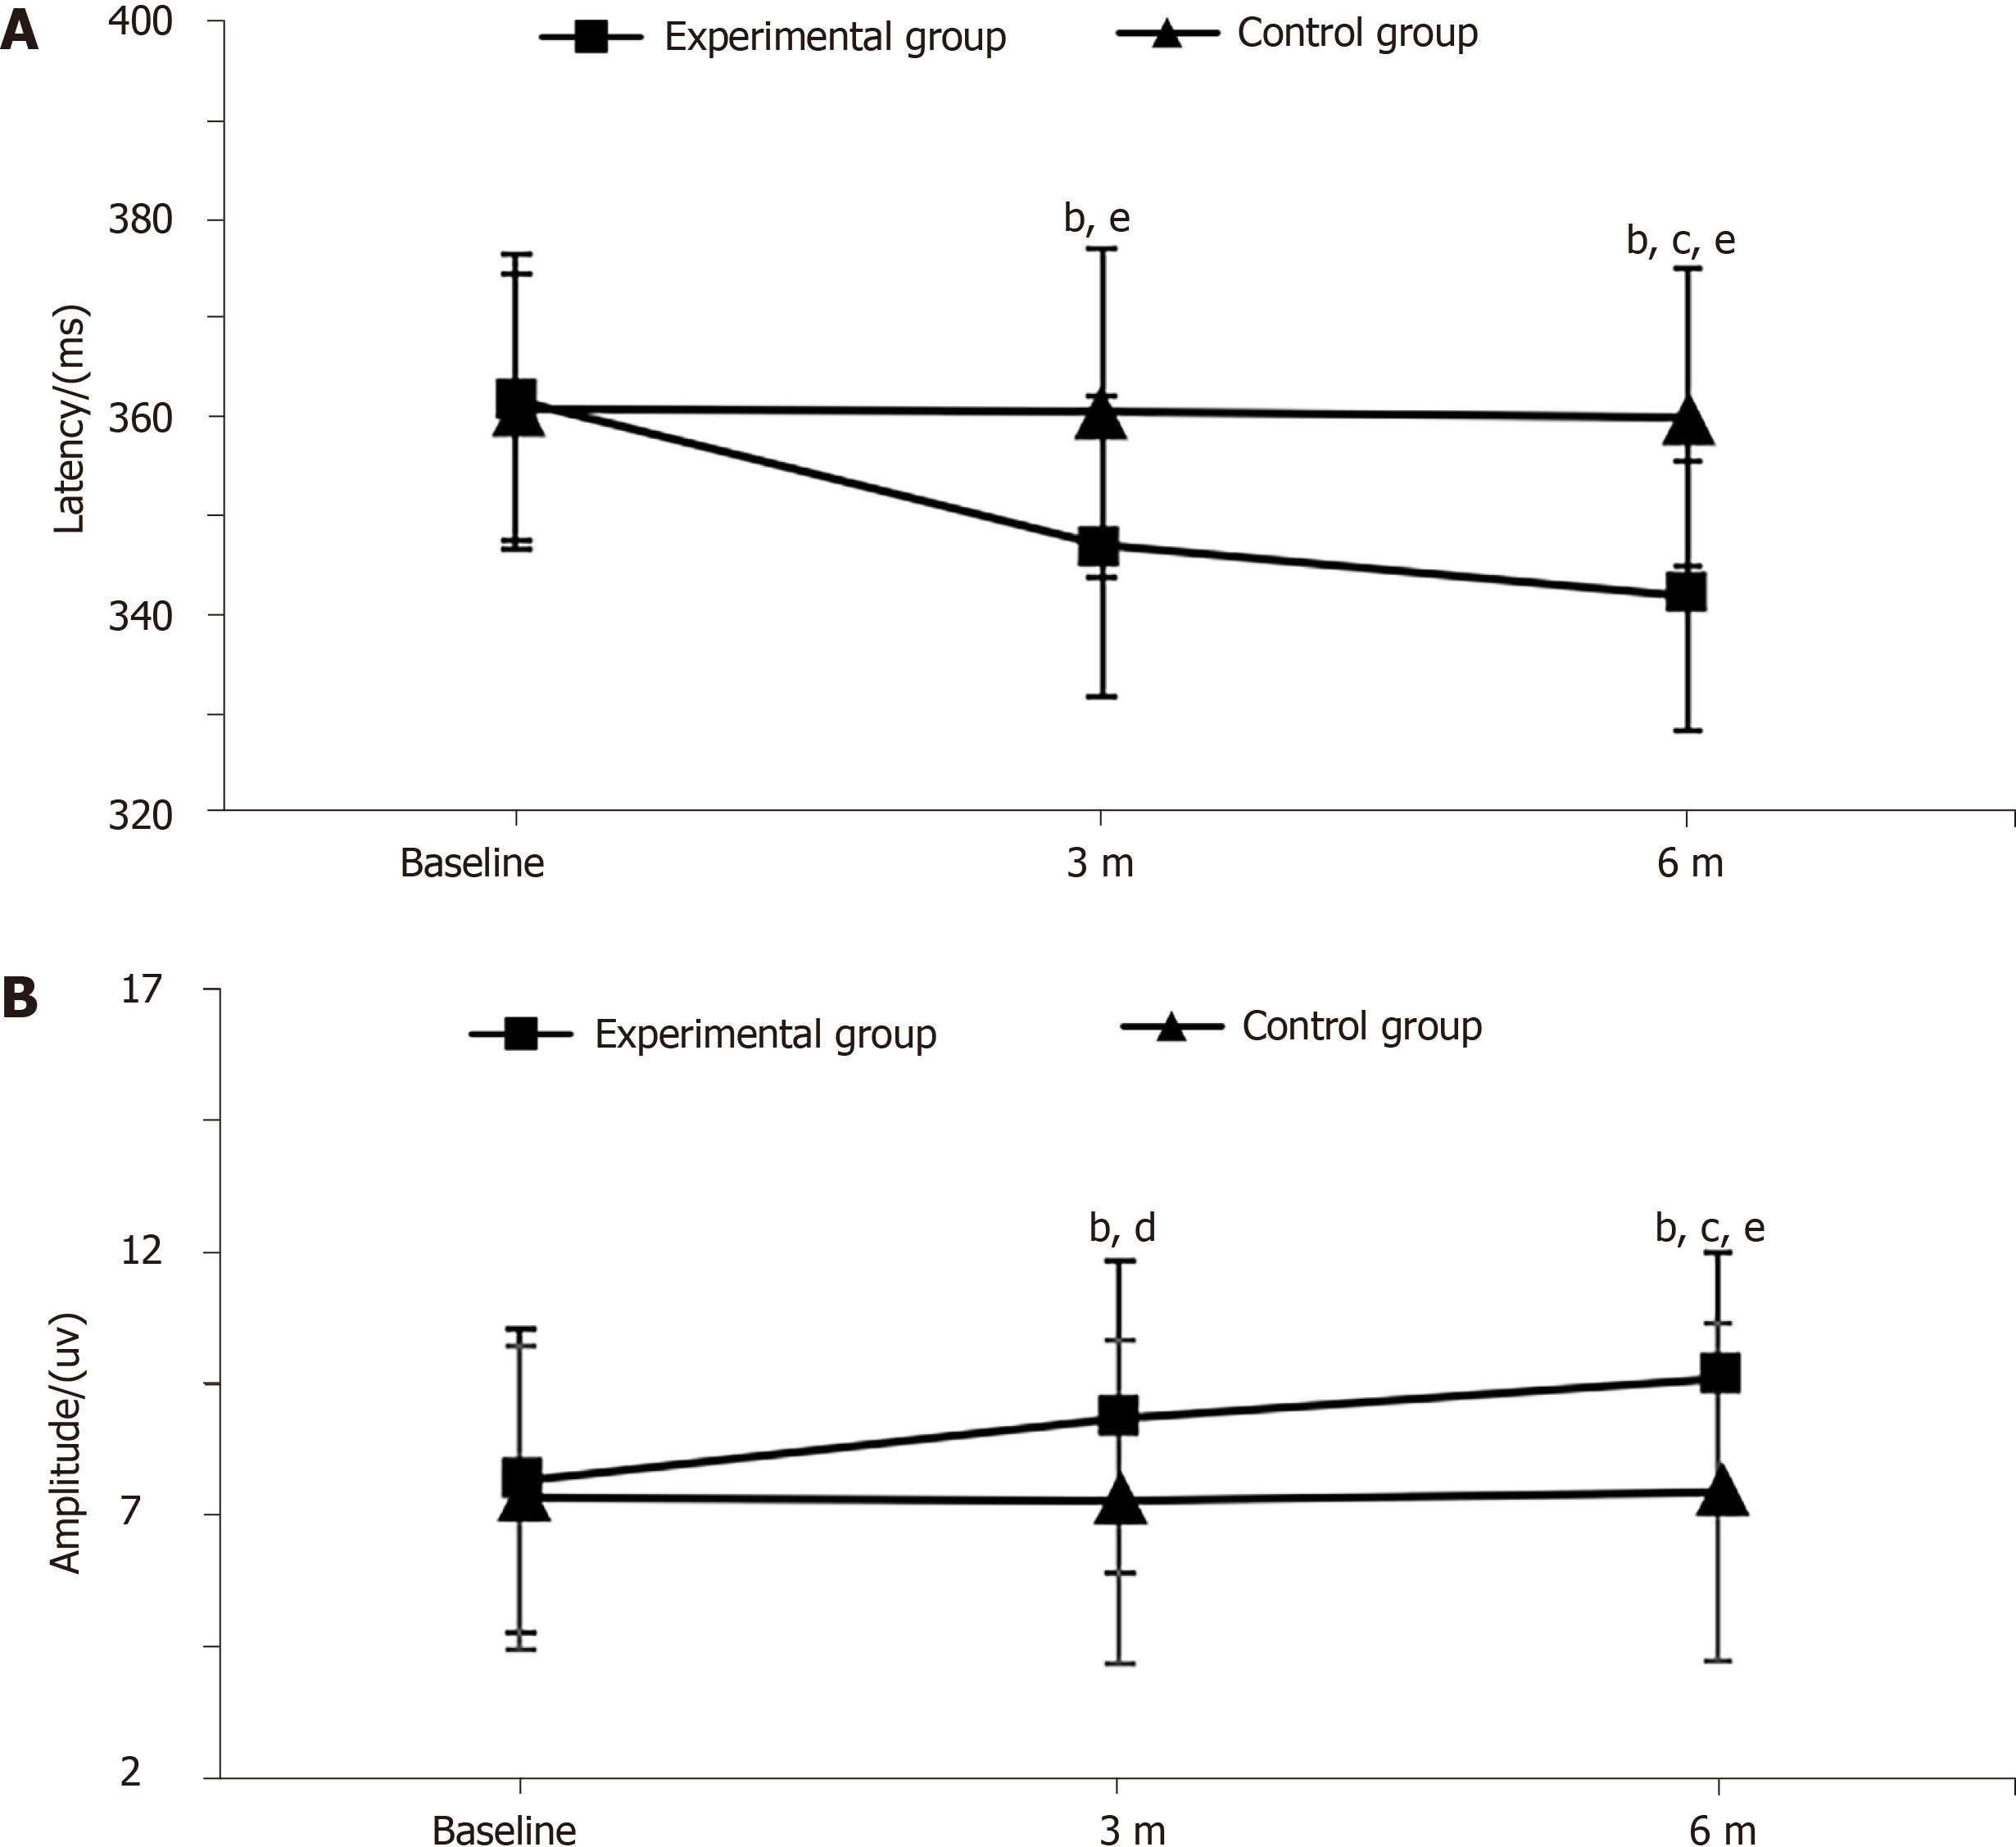
Figure 2 P300 latency and amplitude changes.
A: P300 latency change; B: P300 amplitude change. Intra-group comparison before and after intervention: bP < 0.01 vs baseline; cP < 0.01 vs 3 mo. Comparison between experimental group and control group at different time points: dP < 0.05, eP < 0.01, experimental group vs control group at baseline/3 mo/6 mo.
- Citation: Lin ZG, Li RD, Ai FL, Li S, Zhang XA. Effects of cognitive behavior therapy combined with Baduanjin in patients with colorectal cancer . World J Gastrointest Oncol 2022; 14(1): 319-333
- URL: https://www.wjgnet.com/1948-5204/full/v14/i1/319.htm
- DOI: https://dx.doi.org/10.4251/wjgo.v14.i1.319


