Copyright
©The Author(s) 2021.
World J Gastrointest Oncol. May 15, 2021; 13(5): 440-452
Published online May 15, 2021. doi: 10.4251/wjgo.v13.i5.440
Published online May 15, 2021. doi: 10.4251/wjgo.v13.i5.440
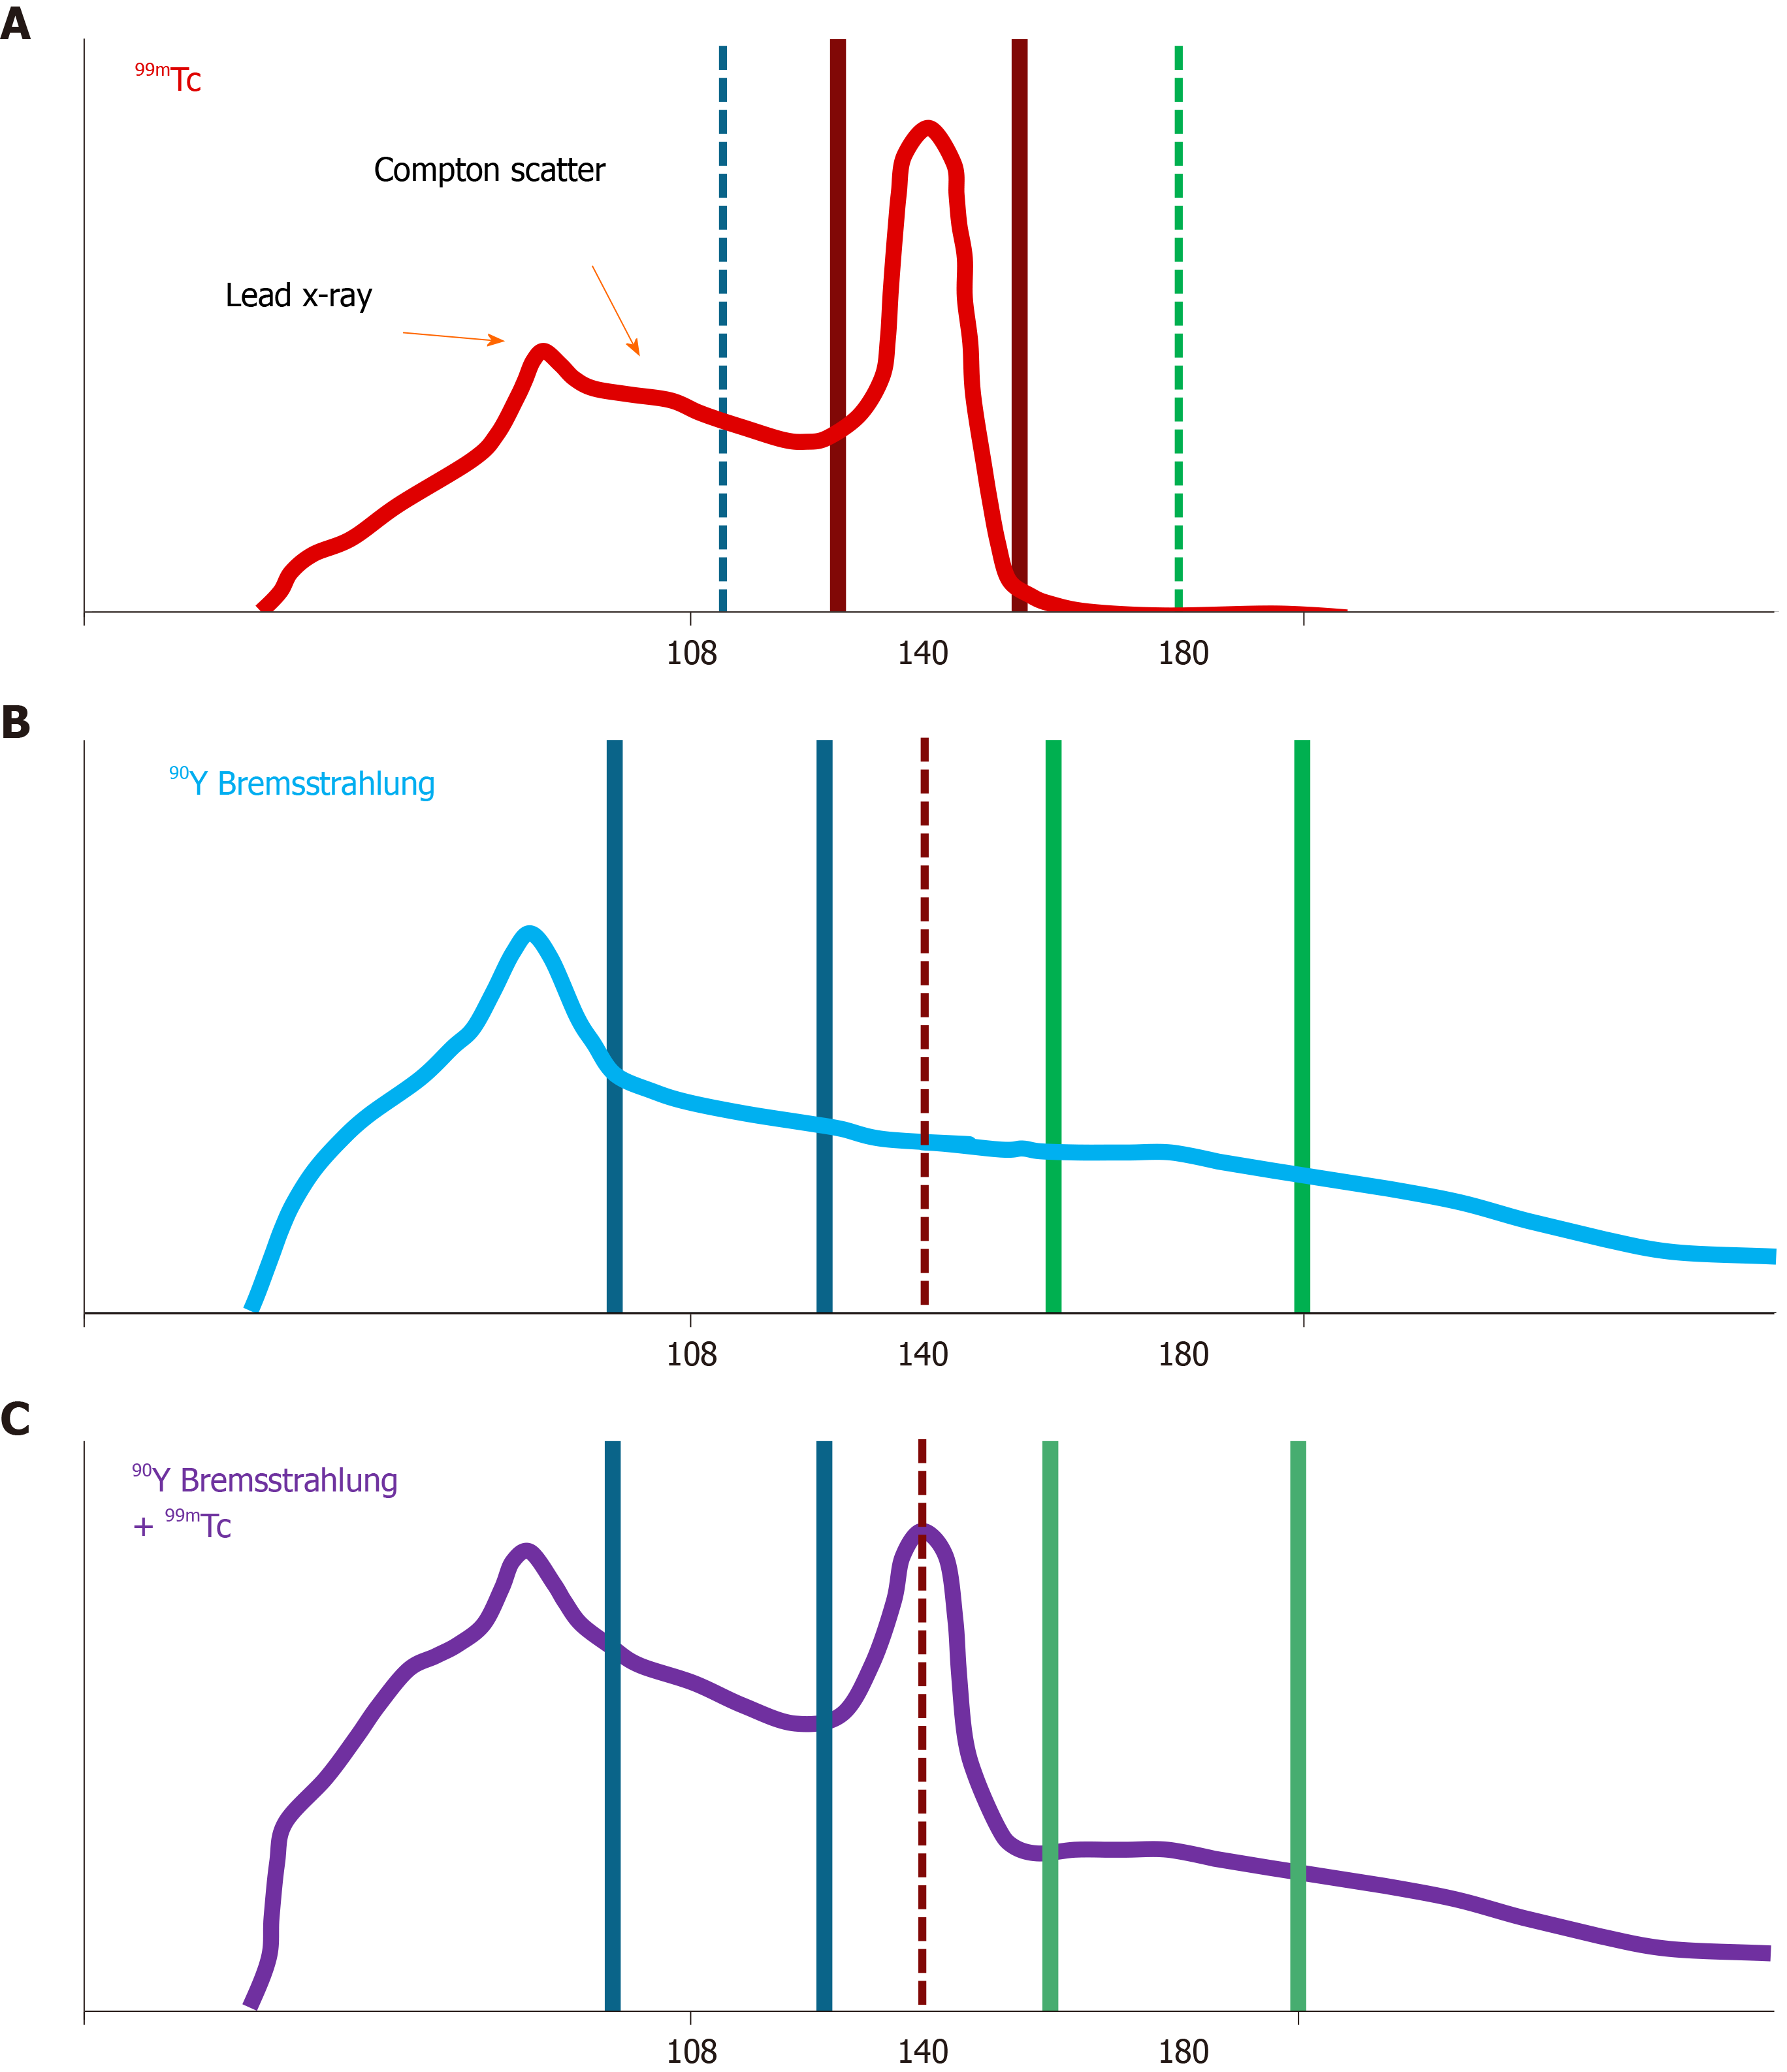
Figure 2 Spectral analysis of Technetium-99m macroaggregated albumin and yttrium-90 during the same-day session.
A: Technetium-99m macroaggregated albumin (Tc-99m MAA) gamma-ray spectrum showing Compton scatter typical of Tc-99m MAA imaging of the liver. The 140 keV, 20% energy window is shown bracketing the 140 keV photopeak (red); B. Yttrium-90 (Y-90) bremsstrahlung exhibits a broad spectrum with no peaks other than the lead x-ray peak that originates in the collimator. Each point on the spectrum is a combination of original bremsstrahlung photons and Compton scatter from higher energy bremsstrahlung. If the only activity present is Y-90, the 108 keV, 32% energy window (blue) is used as it has a good combination of counts and contrast; C: If imaging of Y-90 bremsstrahlung is attempted with Tc-99m already present in the liver, the spectrum is a combination of both Tc-99m gamma-rays and Y-90 bremsstrahlung. A significant portion of the 108 keV, 32% energy window will be from scattered Tc-99m gamma-rays and will not accurately represent the distribution of Y-90 microspheres. A 22% energy window centered at 180 keV (green), however, can be used to demonstrate the activity of Y-90 microspheres without significant contribution from Tc-99m MAA delivered earlier in the day. Tc: Technetium.
- Citation: Elsayed M, Loya M, Galt J, Schuster DM, Bercu ZL, Newsome J, Brandon D, Benenati S, Behbahani K, Duszak R, Sethi I, Kokabi N. Same day yttrium-90 radioembolization with single photon emission computed tomography/computed tomography: An opportunity to improve care during the COVID-19 pandemic and beyond. World J Gastrointest Oncol 2021; 13(5): 440-452
- URL: https://www.wjgnet.com/1948-5204/full/v13/i5/440.htm
- DOI: https://dx.doi.org/10.4251/wjgo.v13.i5.440


