Copyright
©The Author(s) 2021.
World J Gastrointest Oncol. Jan 15, 2021; 13(1): 37-57
Published online Jan 15, 2021. doi: 10.4251/wjgo.v13.i1.37
Published online Jan 15, 2021. doi: 10.4251/wjgo.v13.i1.37
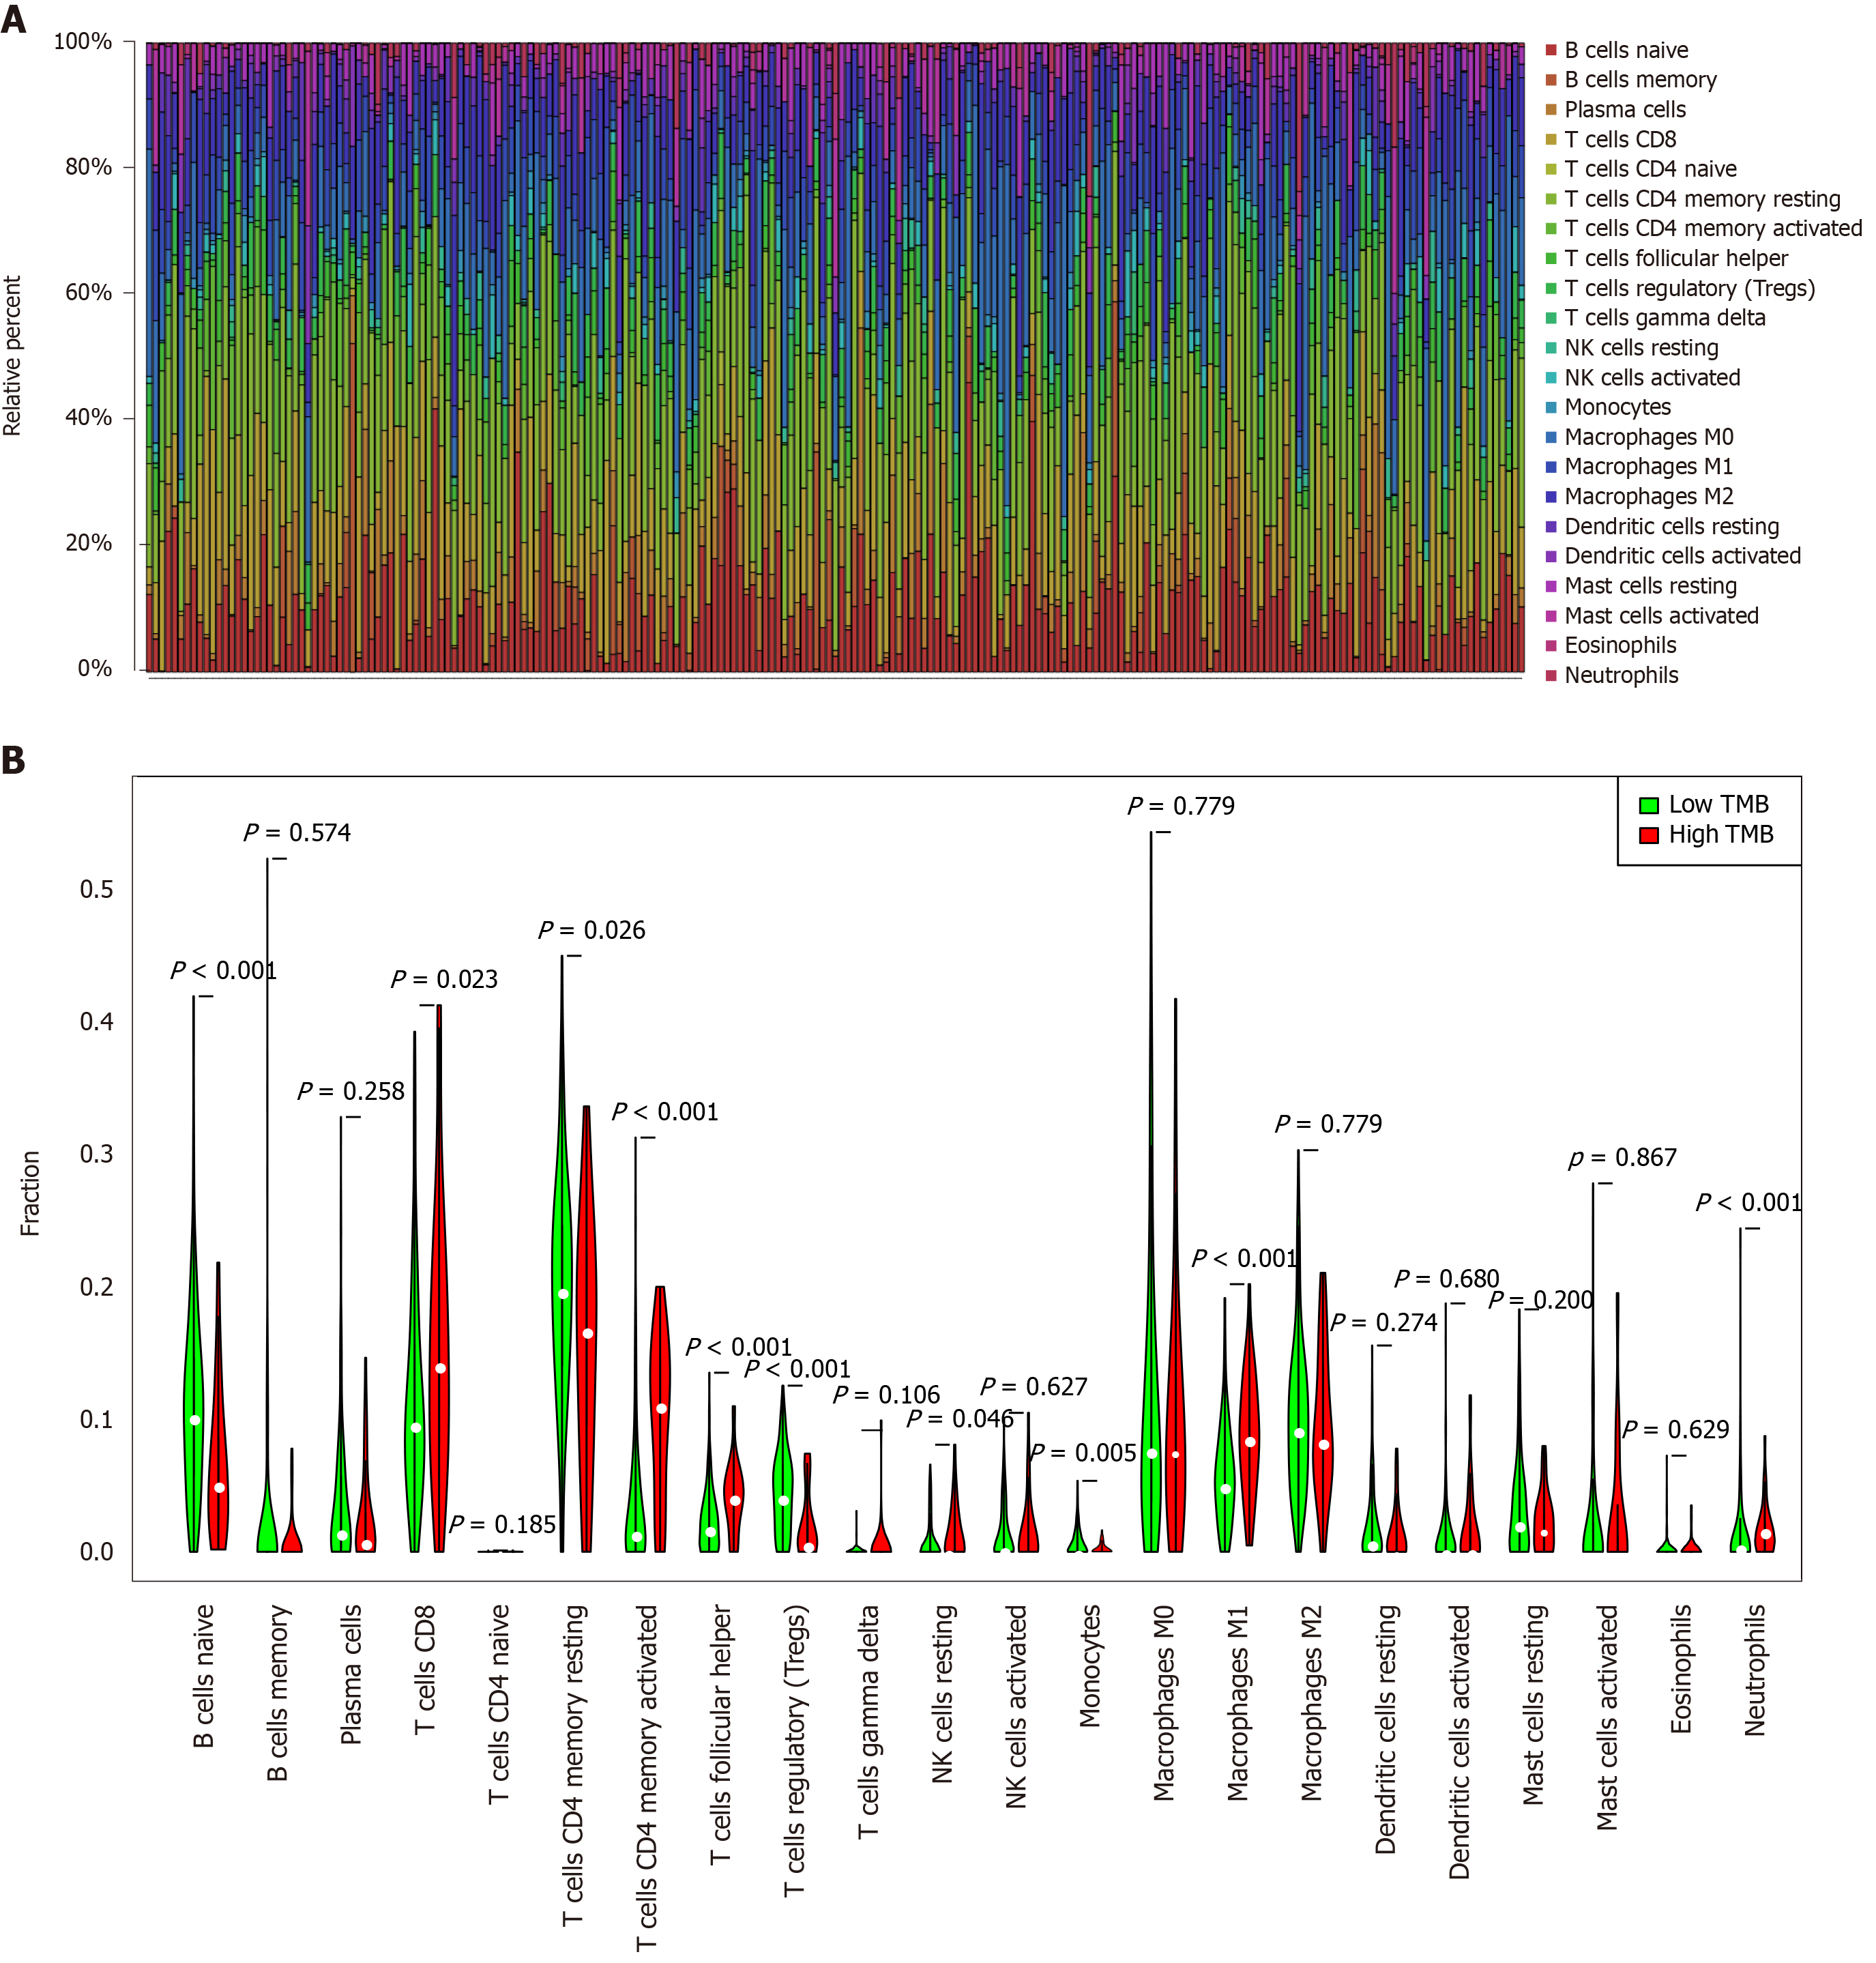
Figure 4 Quantitative analysis of immune infiltration in two groups based on tumor mutation burden status.
A: The box plot of 22 tumor-infiltrating immune cells in each sample; B: Expression comparison of 22 tumor-infiltrating immune cells between the high tumor mutation burden (TMB) and low TMB groups. TMB: Tumor mutation burden.
- Citation: Zhao DY, Sun XZ, Yao SK. Mining The Cancer Genome Atlas database for tumor mutation burden and its clinical implications in gastric cancer. World J Gastrointest Oncol 2021; 13(1): 37-57
- URL: https://www.wjgnet.com/1948-5204/full/v13/i1/37.htm
- DOI: https://dx.doi.org/10.4251/wjgo.v13.i1.37


