Copyright
©The Author(s) 2021.
World J Gastrointest Oncol. Jan 15, 2021; 13(1): 37-57
Published online Jan 15, 2021. doi: 10.4251/wjgo.v13.i1.37
Published online Jan 15, 2021. doi: 10.4251/wjgo.v13.i1.37
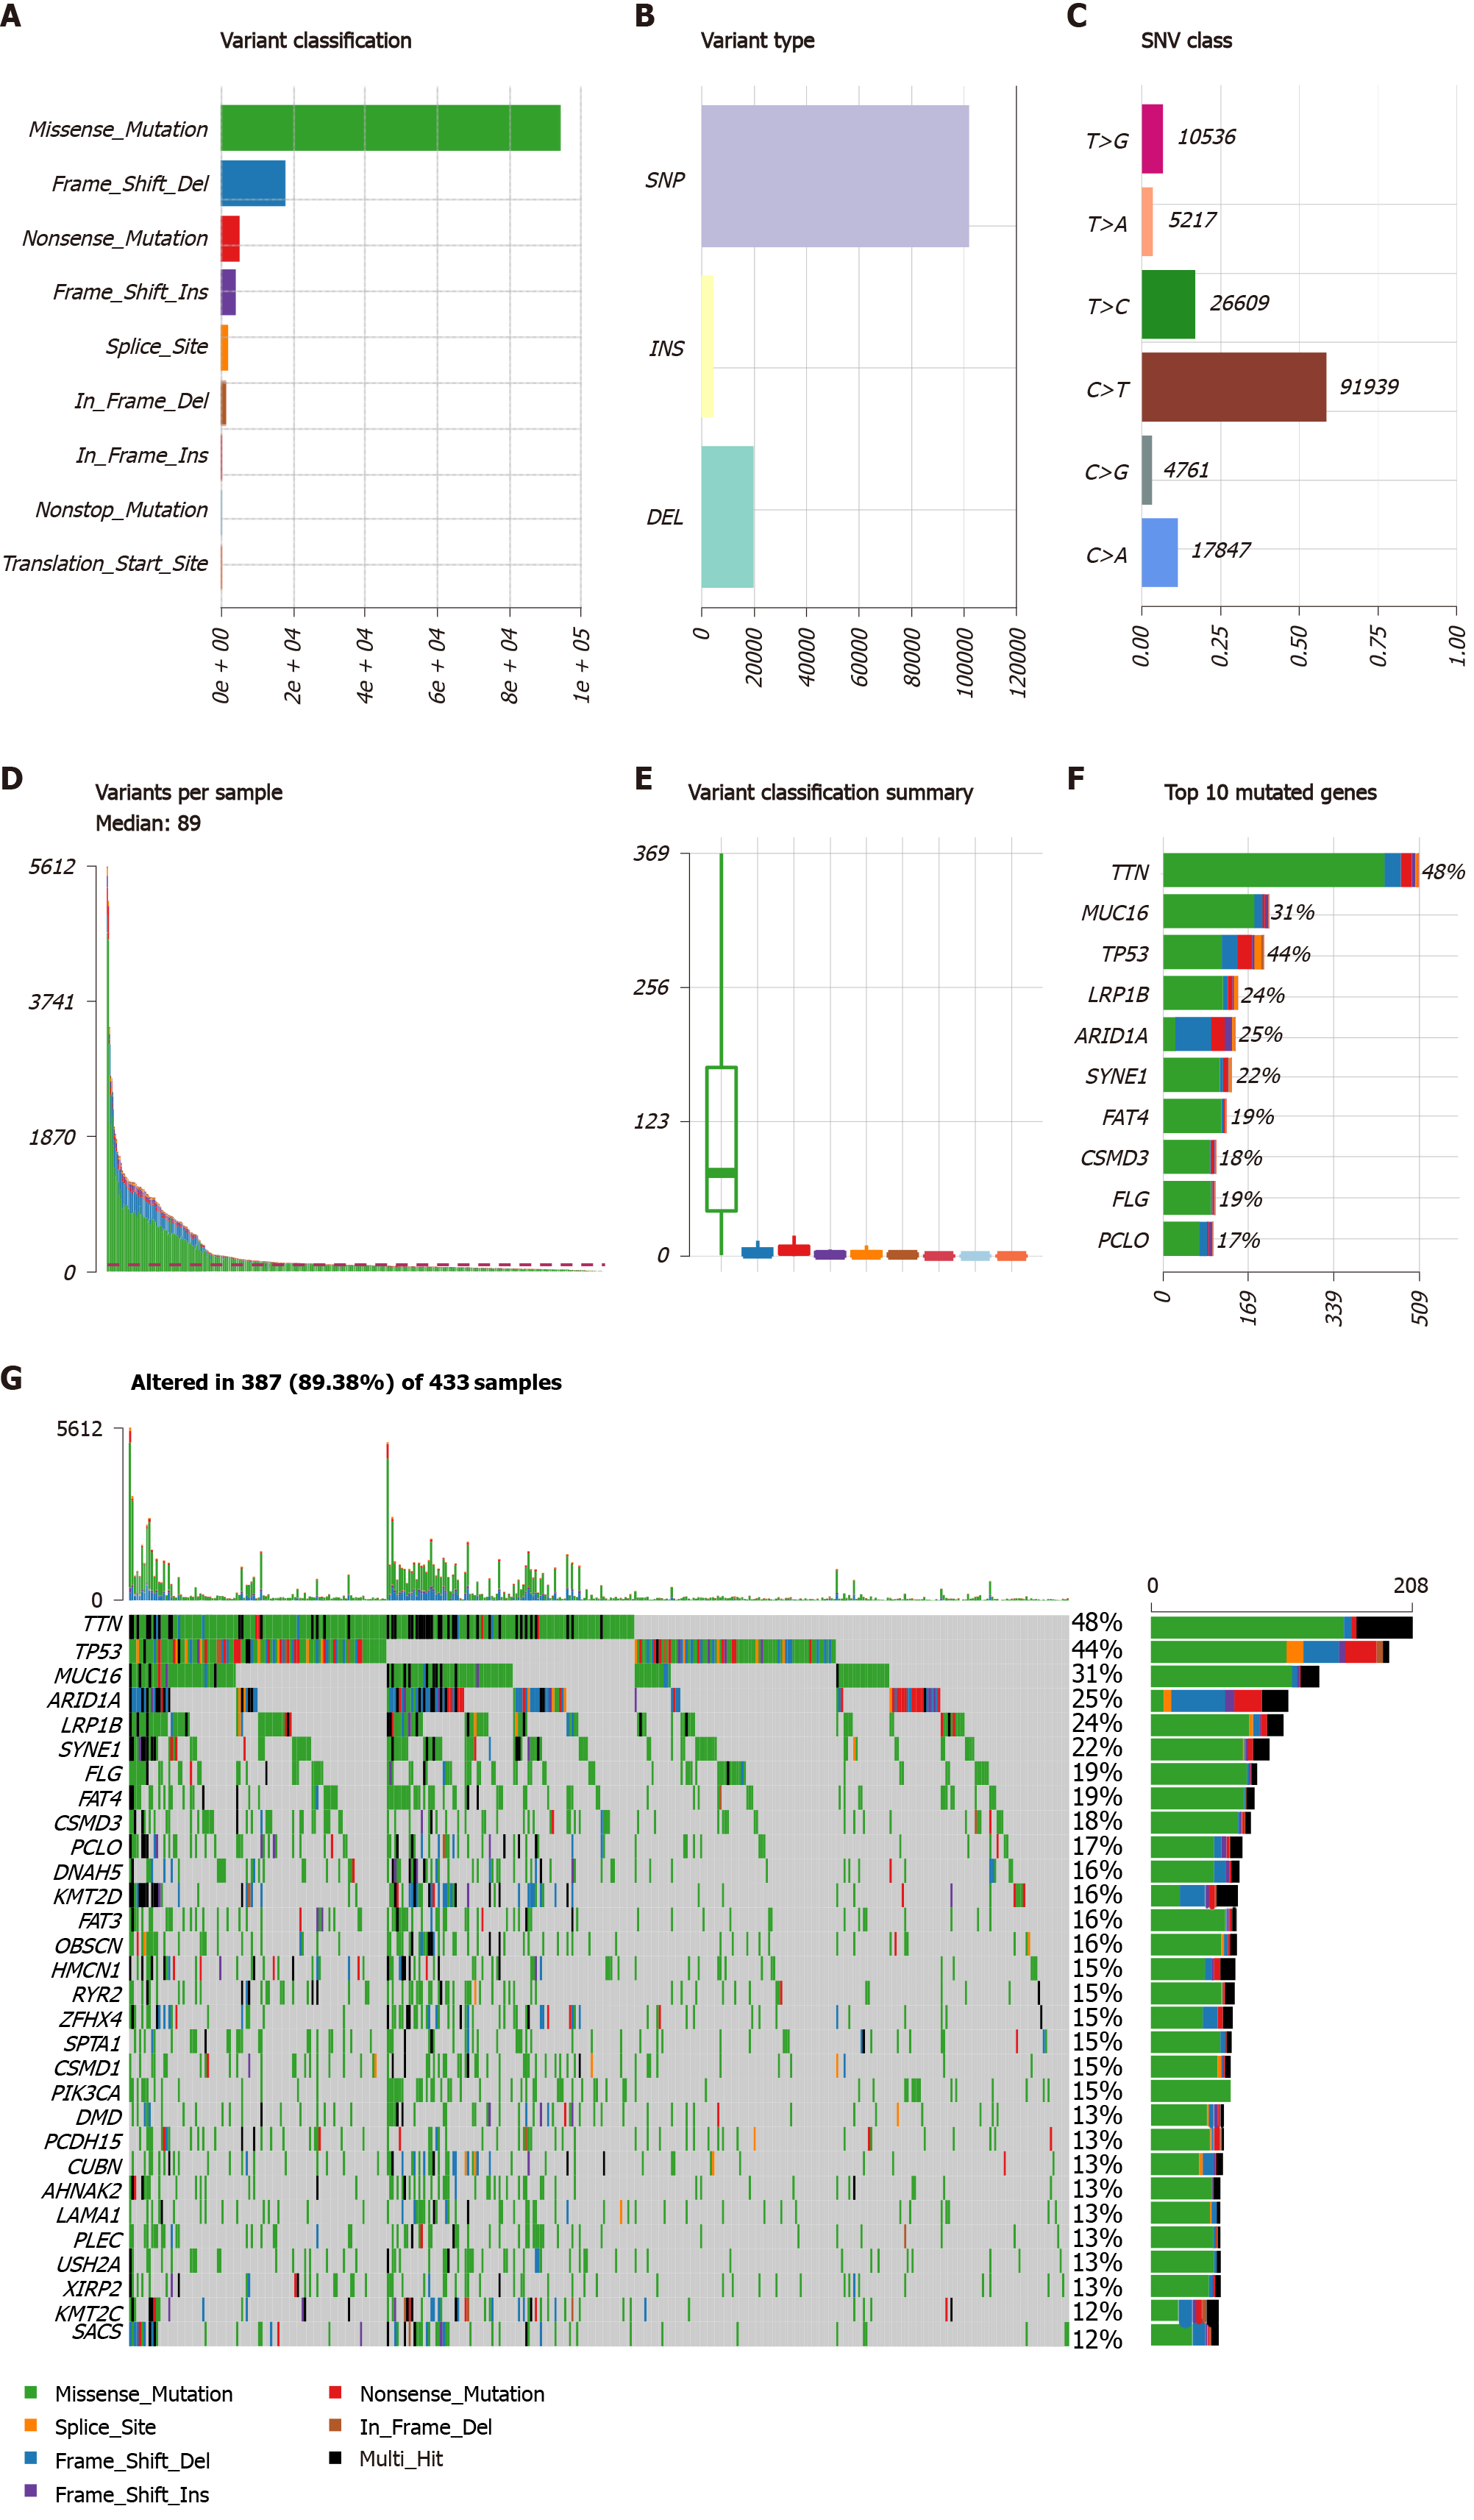
Figure 1 Mutational genomic landscape in The Cancer Genome Atlas gastric cancer cohort.
A: Variant categories; B: Variant types; C: Single nucleotide variant types; D: Number of variants per sample; E: Summary of variant categories; F: Top 10 mutated genes. G: Waterfall map of the top 30 mutated genes and their status of variant categories. Various colors with annotations at the bottom represent the different variant categories while the barplot above the legend exhibits the value of tumor mutational burden. SNV: Single nucleotide variants; SNP: Single nucleotide polymorphism; INS: Insertion; DEL: Deletion; TCGA: The Cancer Genome Atlas.
- Citation: Zhao DY, Sun XZ, Yao SK. Mining The Cancer Genome Atlas database for tumor mutation burden and its clinical implications in gastric cancer. World J Gastrointest Oncol 2021; 13(1): 37-57
- URL: https://www.wjgnet.com/1948-5204/full/v13/i1/37.htm
- DOI: https://dx.doi.org/10.4251/wjgo.v13.i1.37


