Copyright
©The Author(s) 2020.
World J Gastrointest Oncol. Sep 15, 2020; 12(9): 975-991
Published online Sep 15, 2020. doi: 10.4251/wjgo.v12.i9.975
Published online Sep 15, 2020. doi: 10.4251/wjgo.v12.i9.975
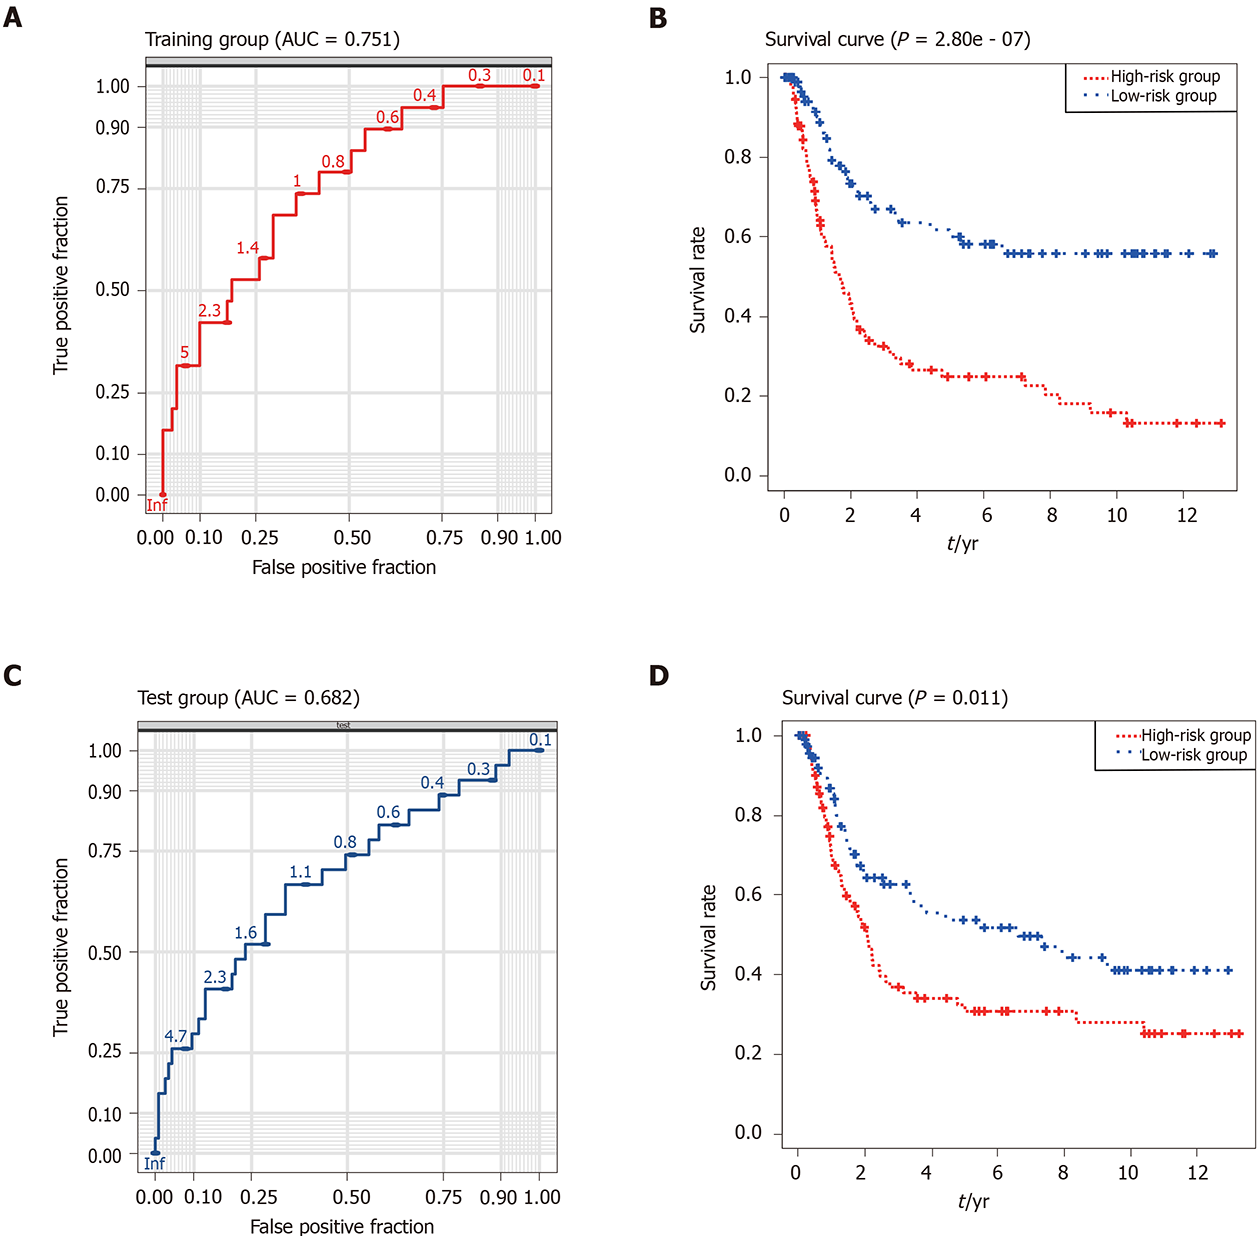
Figure 4 Performance of the risk score model in the training (the Cancer Genome Atlas-stomach adenocarcinoma) and validation (GSE15459) datasets.
A: Receiving operating characteristic curve of the nine-gene signature in the training dataset (area under the curve = 0.751); B: Kaplan–Meier survival curve for gastric carcinoma patients in the training dataset (P < 0.001). C: Receiving operating characteristic curve of the nine-gene signature in the validation datasets (area under the curve = 0.682); D: Kaplan–Meier survival curve for gastric carcinoma patients in the validation dataset (P = 0.011). The blue curve represents low risk score group. The red curve represents high risk score group. AUC: Area under the curve.
- Citation: Wu KZ, Xu XH, Zhan CP, Li J, Jiang JL. Identification of a nine-gene prognostic signature for gastric carcinoma using integrated bioinformatics analyses. World J Gastrointest Oncol 2020; 12(9): 975-991
- URL: https://www.wjgnet.com/1948-5204/full/v12/i9/975.htm
- DOI: https://dx.doi.org/10.4251/wjgo.v12.i9.975


