Copyright
©The Author(s) 2020.
World J Gastrointest Oncol. Sep 15, 2020; 12(9): 975-991
Published online Sep 15, 2020. doi: 10.4251/wjgo.v12.i9.975
Published online Sep 15, 2020. doi: 10.4251/wjgo.v12.i9.975
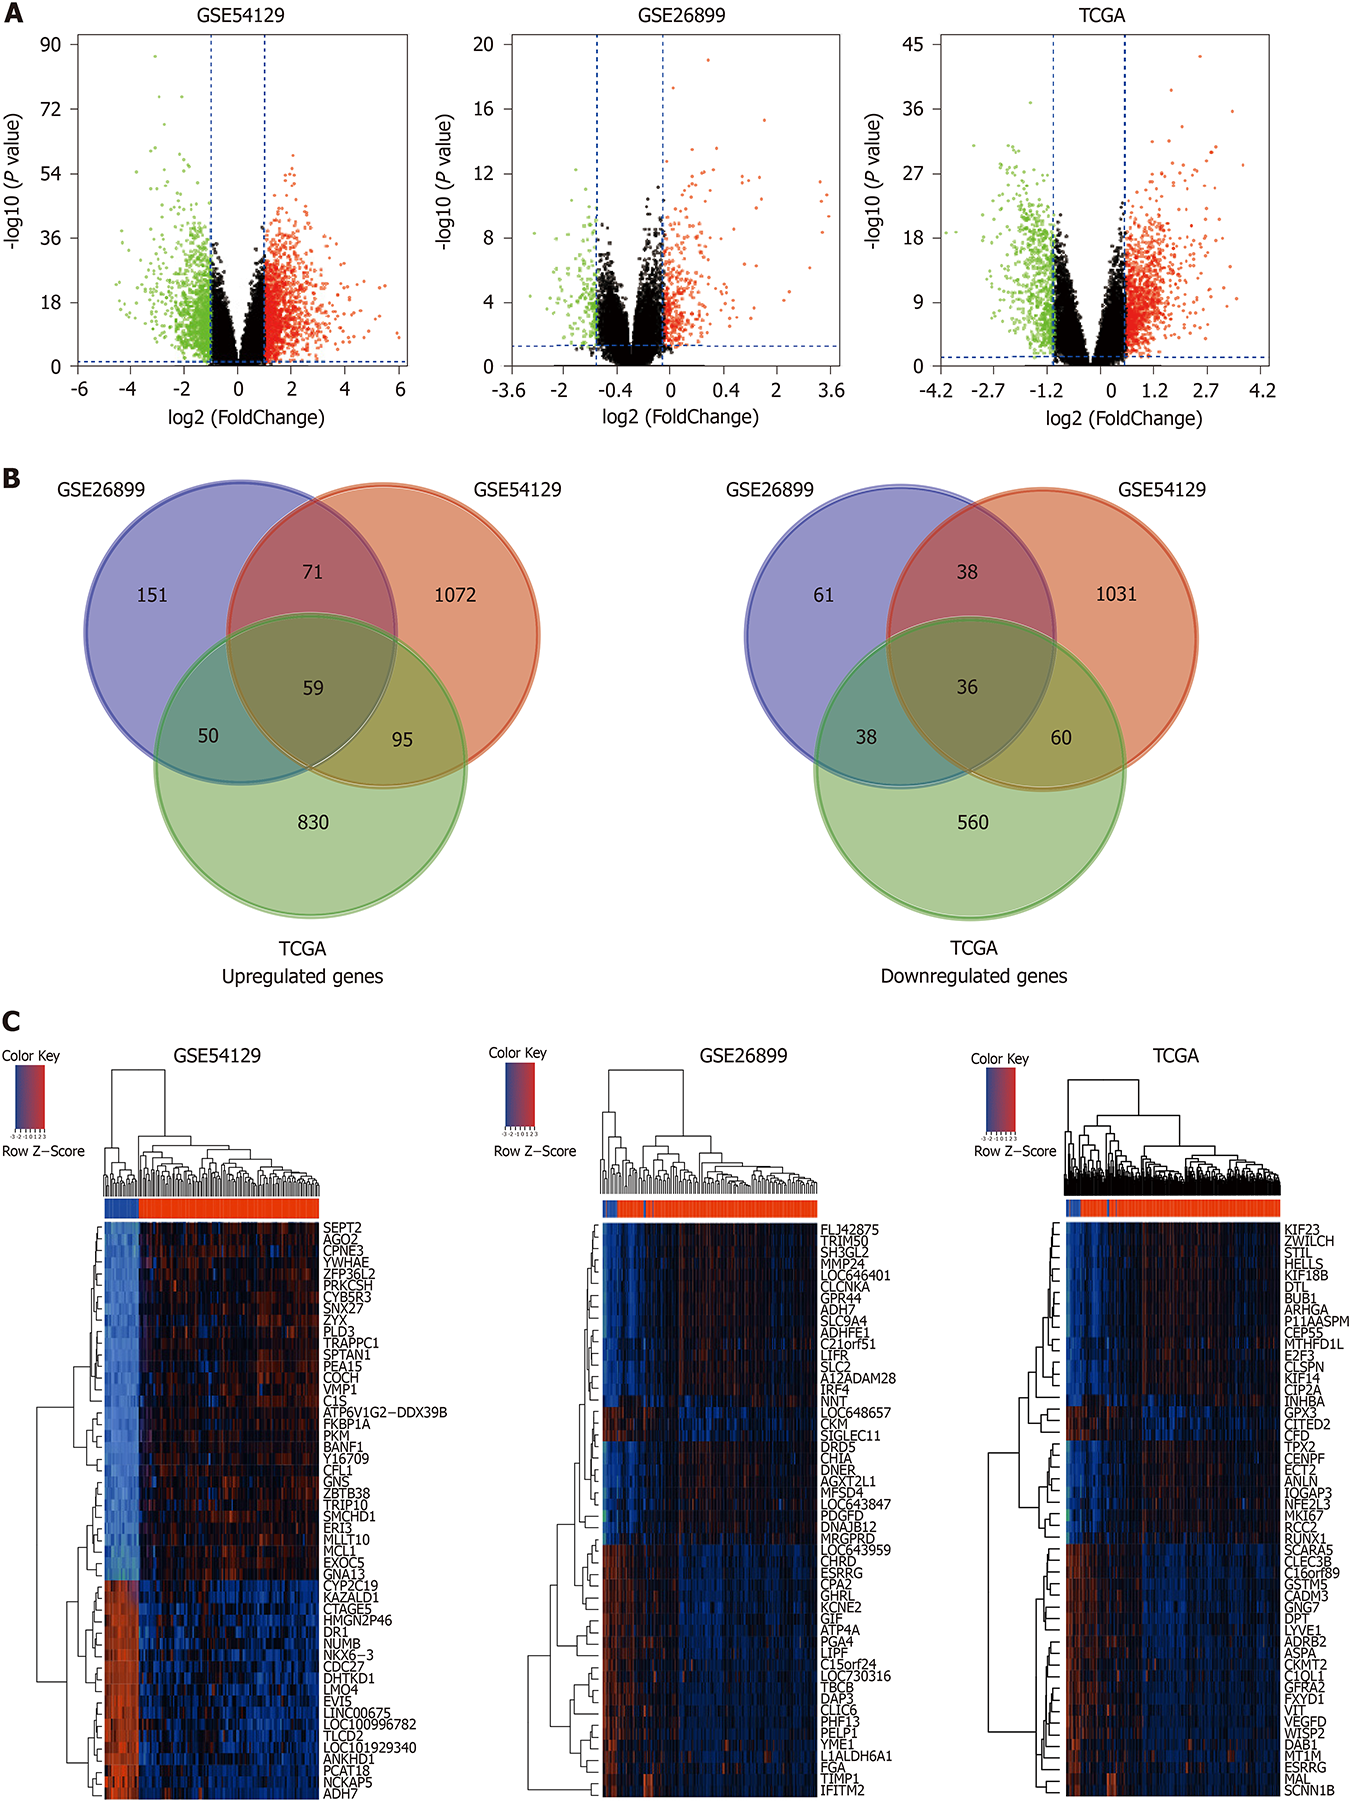
Figure 2 Differentially expressed genes between gastric carcinoma and normal gastric tissues.
A: Volcano plots visualizing the differentially expressed genes (DEGs) between gastric carcinoma and non-cancerous tissues in GSE54129, GSE26899, and The Cancer Genome Atlas datasets. Red dots represent significantly up-regulated genes; green dots represent significantly down-regulated genes; black dots represent non-differentially expressed genes. P < 0.05 and |log2 FC| > 1.0 were considered significant; B: Venn diagrams showing the upregulated overlapped DEGs (left) and downregulated overlapped DEGs (right) in three datasets; C: Heatmaps of the common genes in GSE54129, GSE26899, and The Cancer Genome Atlas datasets (top 50). The common genes include 59 upregulated genes and 36 downregulated genes. Each row represents the expression level of a gene, and each column represents a sample: Red for gastric carcinoma and blue for non-cancerous samples.
- Citation: Wu KZ, Xu XH, Zhan CP, Li J, Jiang JL. Identification of a nine-gene prognostic signature for gastric carcinoma using integrated bioinformatics analyses. World J Gastrointest Oncol 2020; 12(9): 975-991
- URL: https://www.wjgnet.com/1948-5204/full/v12/i9/975.htm
- DOI: https://dx.doi.org/10.4251/wjgo.v12.i9.975


