Copyright
©The Author(s) 2020.
World J Gastrointest Oncol. Aug 15, 2020; 12(8): 931-941
Published online Aug 15, 2020. doi: 10.4251/wjgo.v12.i8.931
Published online Aug 15, 2020. doi: 10.4251/wjgo.v12.i8.931
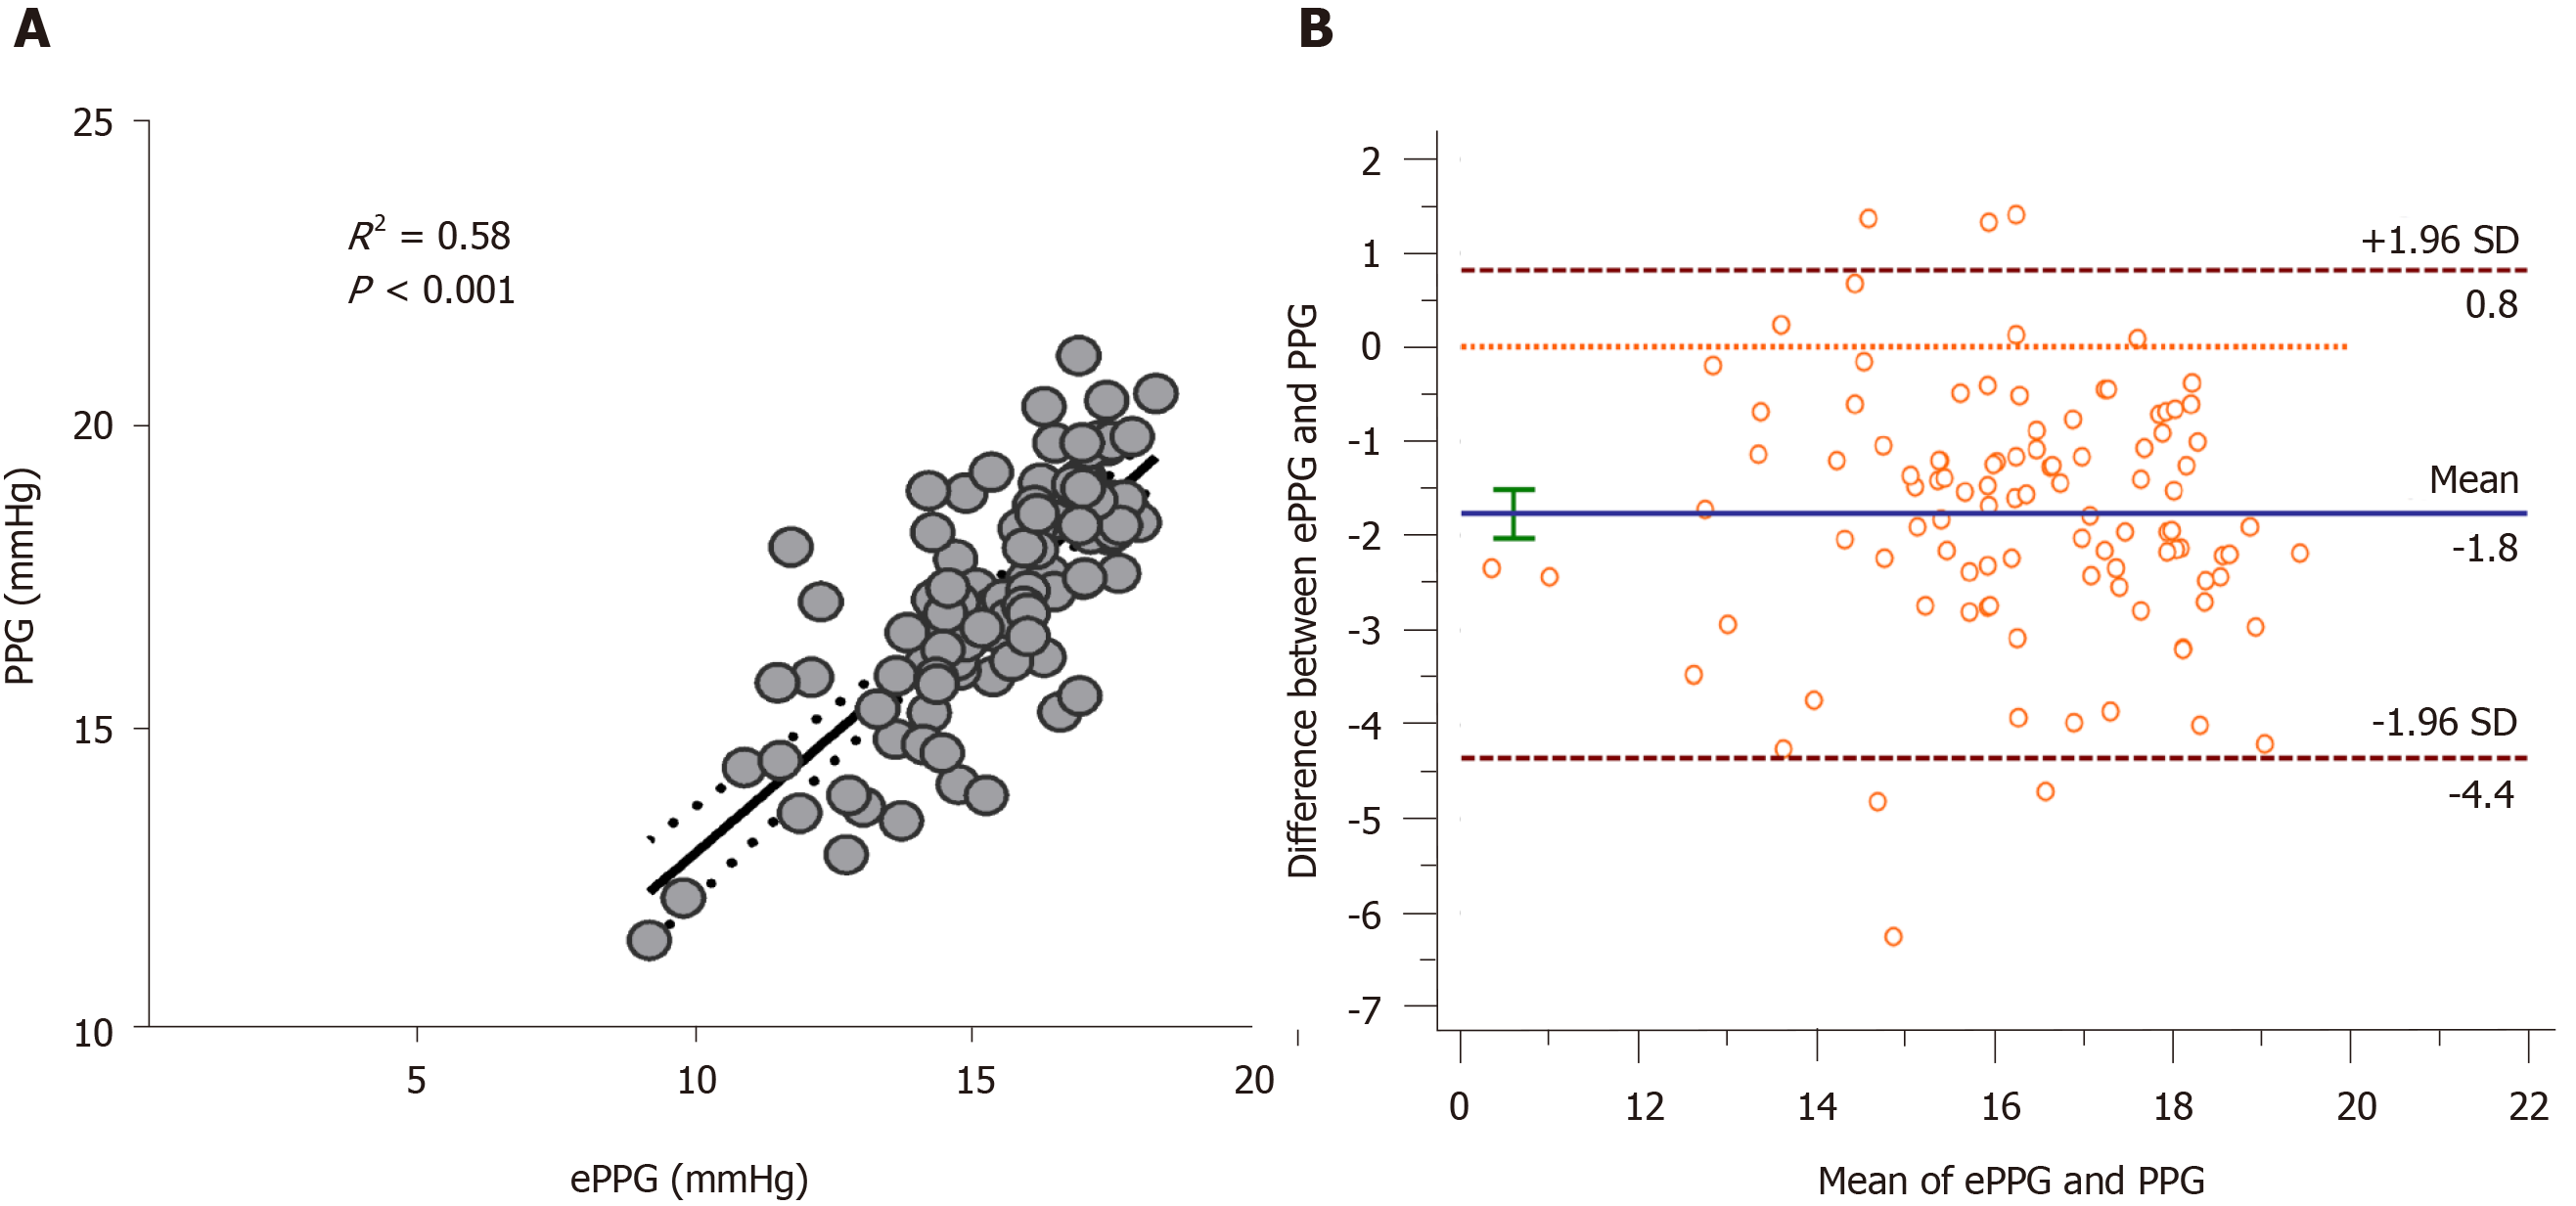
Figure 2 Correlation between portal pressure gradient and estimated portal pressure gradient in the overall group.
A: Scatterplot shows agreement between portal pressure gradient (PPG) and estimated PPG (ePPG); B: Bland-Altman plot shows the difference between PPG and ePPG.
- Citation: Zhang Y, Wang Z, Yue ZD, Zhao HW, Wang L, Fan ZH, Wu YF, He FL, Liu FQ. Accurate ultrasonography-based portal pressure assessment in patients with hepatocellular carcinoma. World J Gastrointest Oncol 2020; 12(8): 931-941
- URL: https://www.wjgnet.com/1948-5204/full/v12/i8/931.htm
- DOI: https://dx.doi.org/10.4251/wjgo.v12.i8.931


