Copyright
©The Author(s) 2020.
World J Gastrointest Oncol. Aug 15, 2020; 12(8): 877-892
Published online Aug 15, 2020. doi: 10.4251/wjgo.v12.i8.877
Published online Aug 15, 2020. doi: 10.4251/wjgo.v12.i8.877
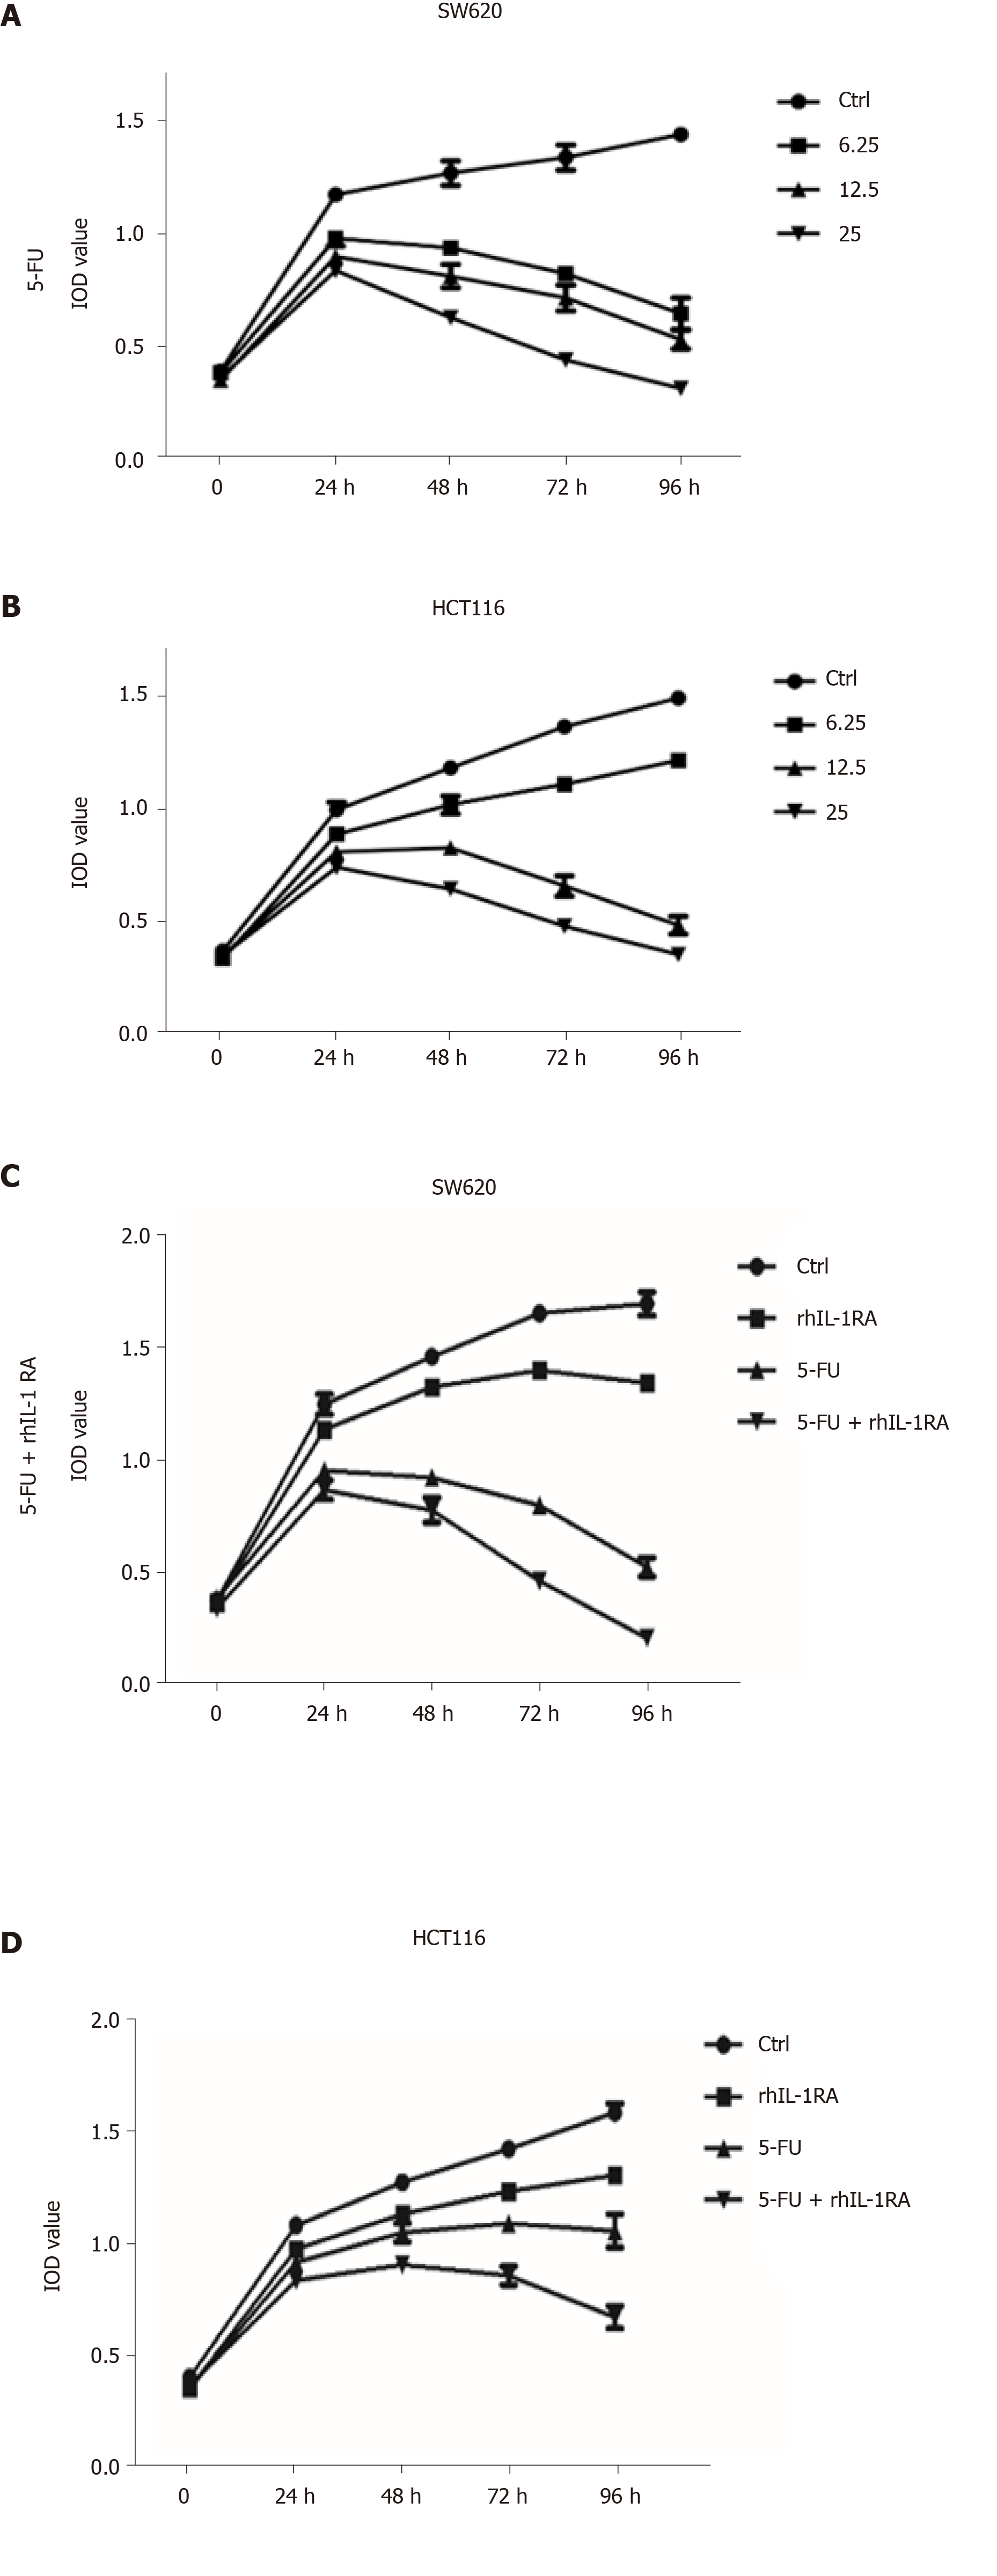
Figure 5 Changes in the growth curves of the SW620 and HCT116 cell lines treated with interleukin-1RA and/or fluorouracil.
A and B: MTT assays showed that the cell growth curves of the SW620 and HCT116 colon cancer cell lines treated with fluorouracil (5-FU) at concentrations of 6.25, 12.5, and 25 mg/mL exhibited a downward trend (SW620: 5-FU at 6.25 µg/mL for 96 h vs Ctrl, P < 0.0001; HCT116: 5-FU at 6.25 µg/mL for 96 h vs Ctrl, P < 0.0001); C: MTT assays showed that the cell growth curve of the SW620 colon cancer cell lines treated with interleukin (IL)-1RA was significantly different compared with the Ctrl (SW620: IL-1RA at 200 µg/mL for 96 h vs Ctrl, P = 0.0005). The cell growth curve of the SW620 colon cancer cell lines treated with IL-1RA combined with 5-FU significantly decreased compared to that in the 5-FU group (SW620: 5-FU at 12.5 µg/mL and IL-1RA at 200 µg/mL for 96 h vs 5-FU at 12.5 µg/mL, P = 0.0003); D: MTT assays showed that the cell growth curve of the HCT116 colon cancer cell lines treated with IL-1RA was significantly different compared with that of the Ctrl (HCT116: IL-1RA at 200 µg/mL for 96 h vs Ctrl, P = 0.0004). The cell growth curve of the SW620 colon cancer cell lines treated with IL-1RA combined with 5-FU significantly decreased compared to that in the 5-FU group (HCT116: 5-FU at 12.5 µg/mL and IL-1RA at 200 µg/mL for 96 h vs 5-FU at 12.5 µg/mL, P = 0.0027).
- Citation: Yan Y, Lin HW, Zhuang ZN, Li M, Guo S. Interleukin-1 receptor antagonist enhances chemosensitivity to fluorouracil in treatment of Kras mutant colon cancer. World J Gastrointest Oncol 2020; 12(8): 877-892
- URL: https://www.wjgnet.com/1948-5204/full/v12/i8/877.htm
- DOI: https://dx.doi.org/10.4251/wjgo.v12.i8.877


