Copyright
©The Author(s) 2020.
World J Gastrointest Oncol. May 15, 2020; 12(5): 535-548
Published online May 15, 2020. doi: 10.4251/wjgo.v12.i5.535
Published online May 15, 2020. doi: 10.4251/wjgo.v12.i5.535
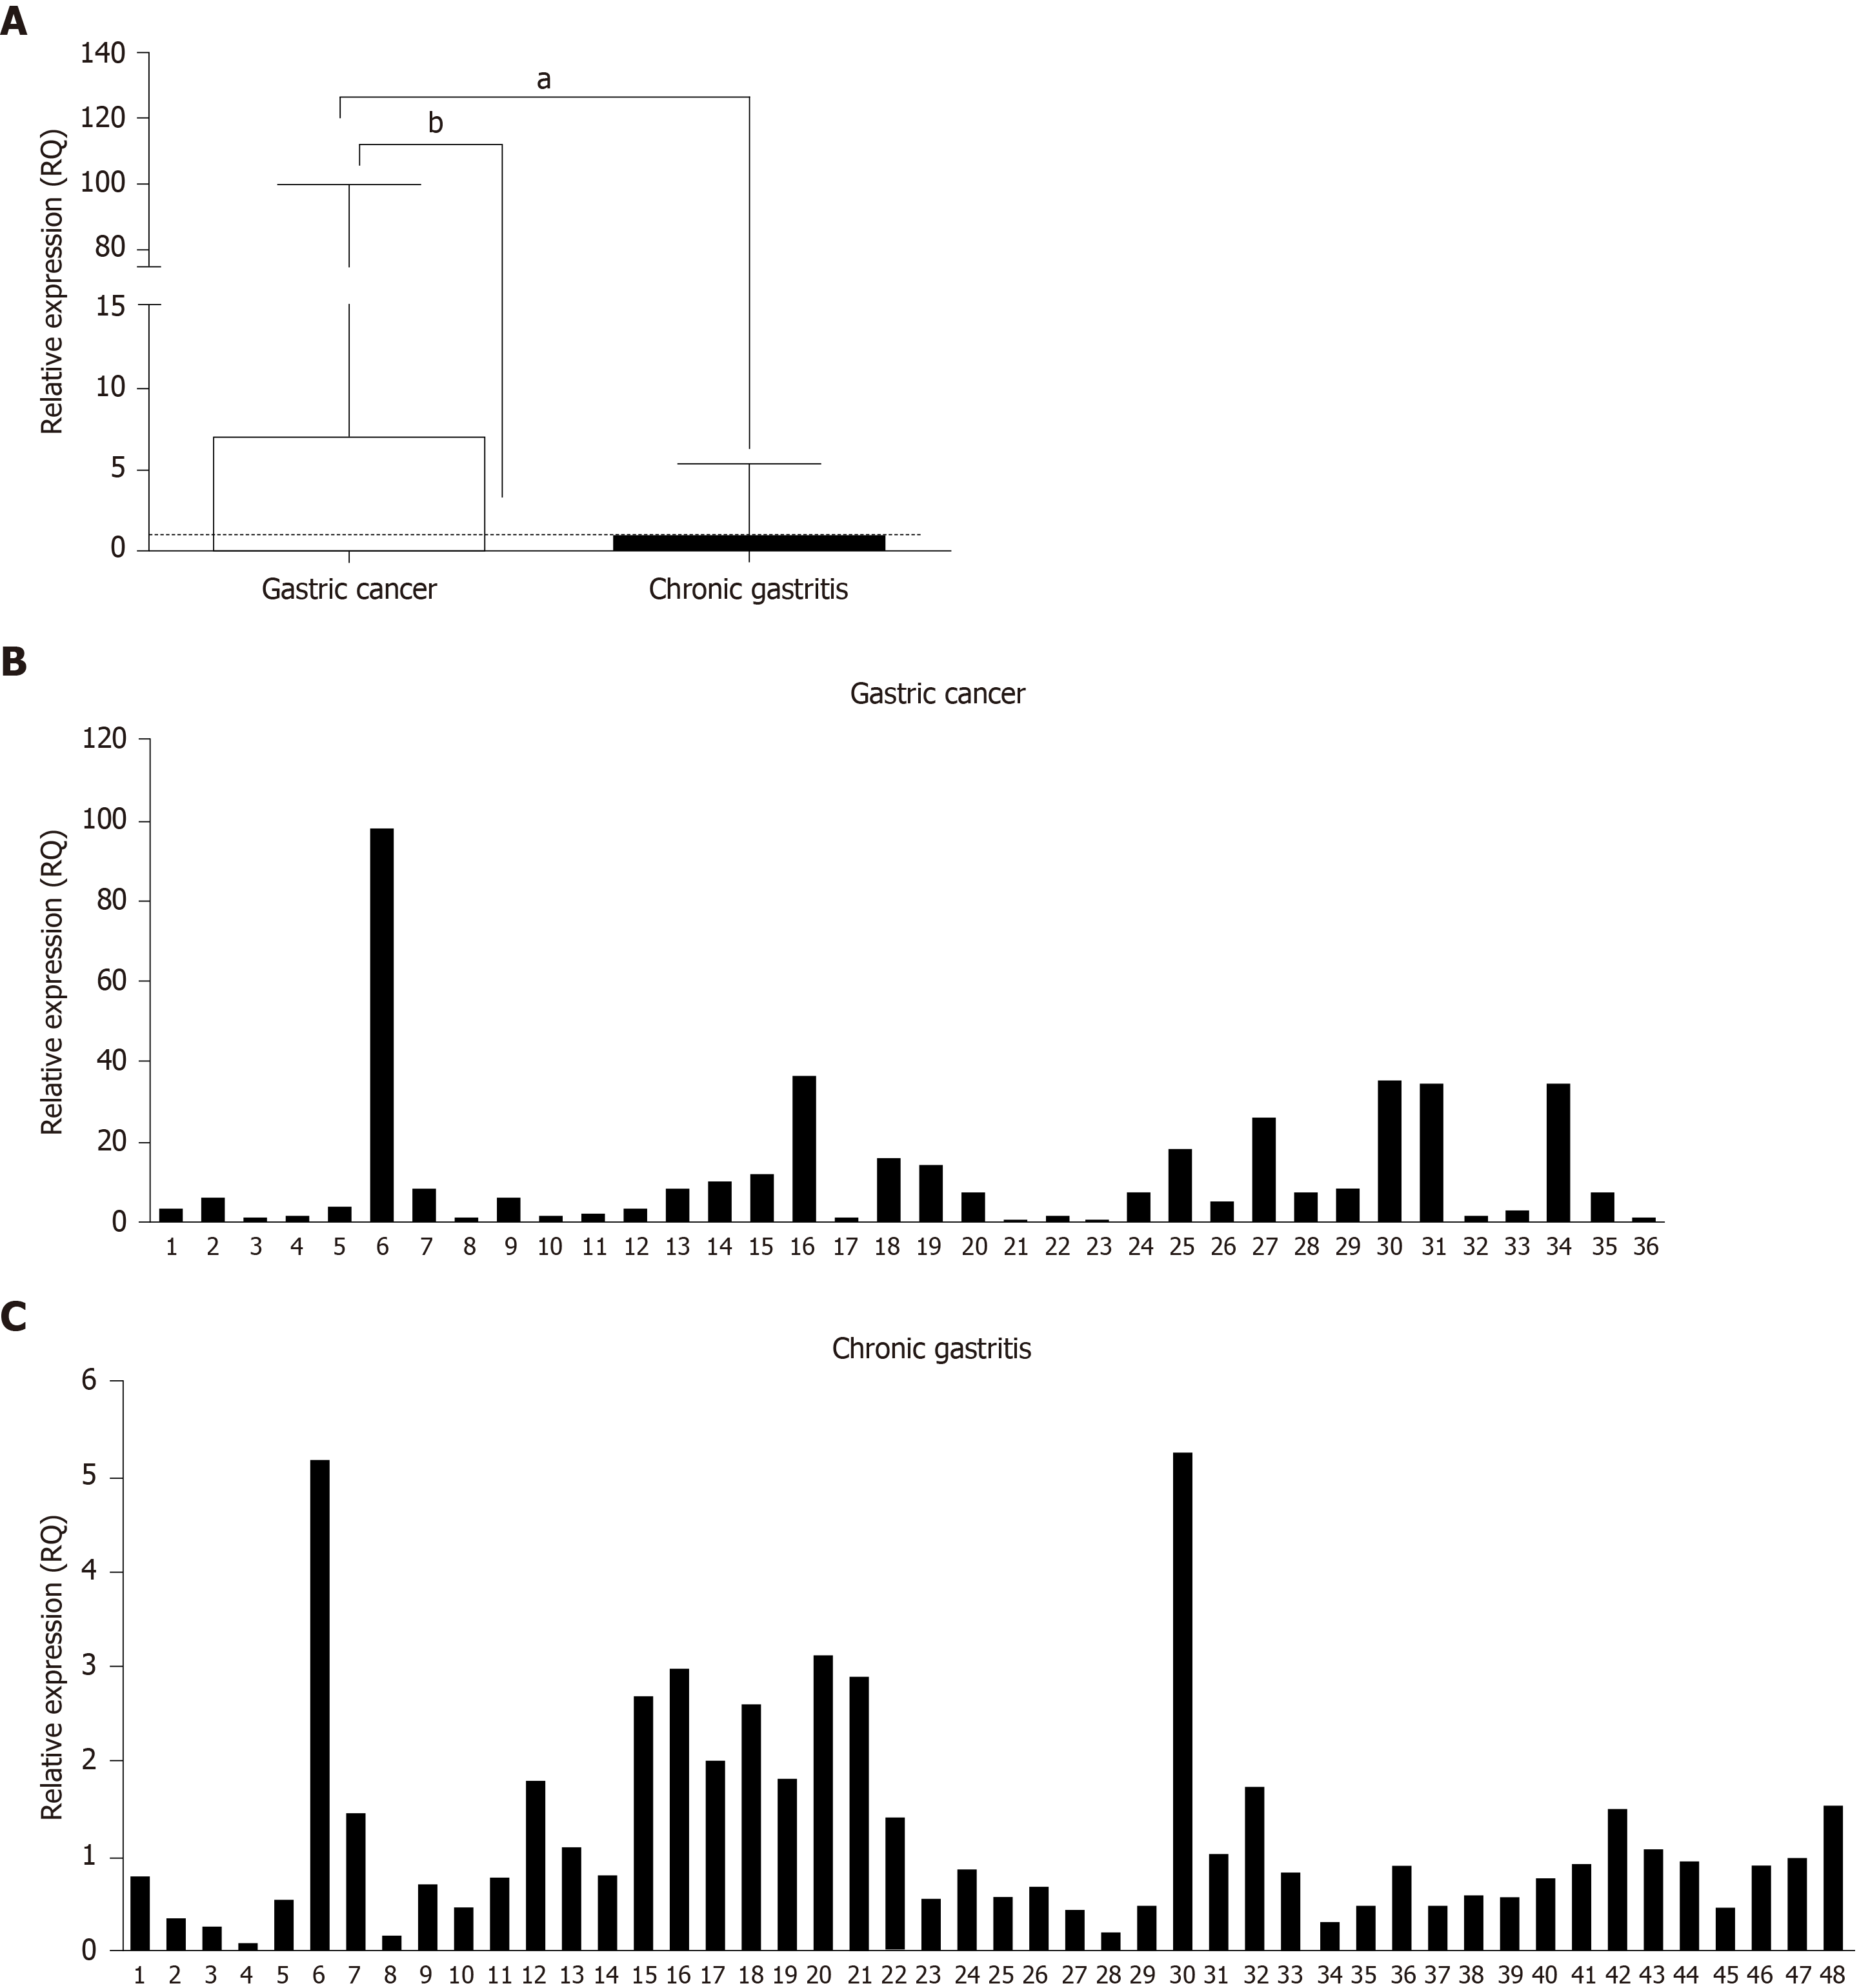
Figure 1 Relative gene expression levels of TLR2.
A: Comparison between gastric cancer (GC) and chronic gastritis groups (CG), aP < 0.0001; and GC or CG groups with samples of normal mucosa (RQ = 1 represented for dashed line), bP < 0.0001 and P = 0.9387, respectively. B: Individual representation of RQ for each sample of GC group; C: Individual representation of relative quantification (RQ) for each sample of CG group. Significant difference, a, bP < 0.05. RQ represented by median with interquartile range. Mann-Whitney and Wilcoxon Signed statistical test.
- Citation: Lourenço CM, Susi MD, Nascimento MCAD, Serafim Junior V, Vila APS, Rodrigues-Flemming GH, Goloni-Bertollo EM, Silva AE, Oliveira-Cucolo JG. Characterization and strong risk association of TLR2 del -196 to -174 polymorphism and Helicobacter pylori and their influence on mRNA expression in gastric cancer. World J Gastrointest Oncol 2020; 12(5): 535-548
- URL: https://www.wjgnet.com/1948-5204/full/v12/i5/535.htm
- DOI: https://dx.doi.org/10.4251/wjgo.v12.i5.535


