Copyright
©The Author(s) 2020.
World J Gastrointest Oncol. May 15, 2020; 12(5): 514-525
Published online May 15, 2020. doi: 10.4251/wjgo.v12.i5.514
Published online May 15, 2020. doi: 10.4251/wjgo.v12.i5.514
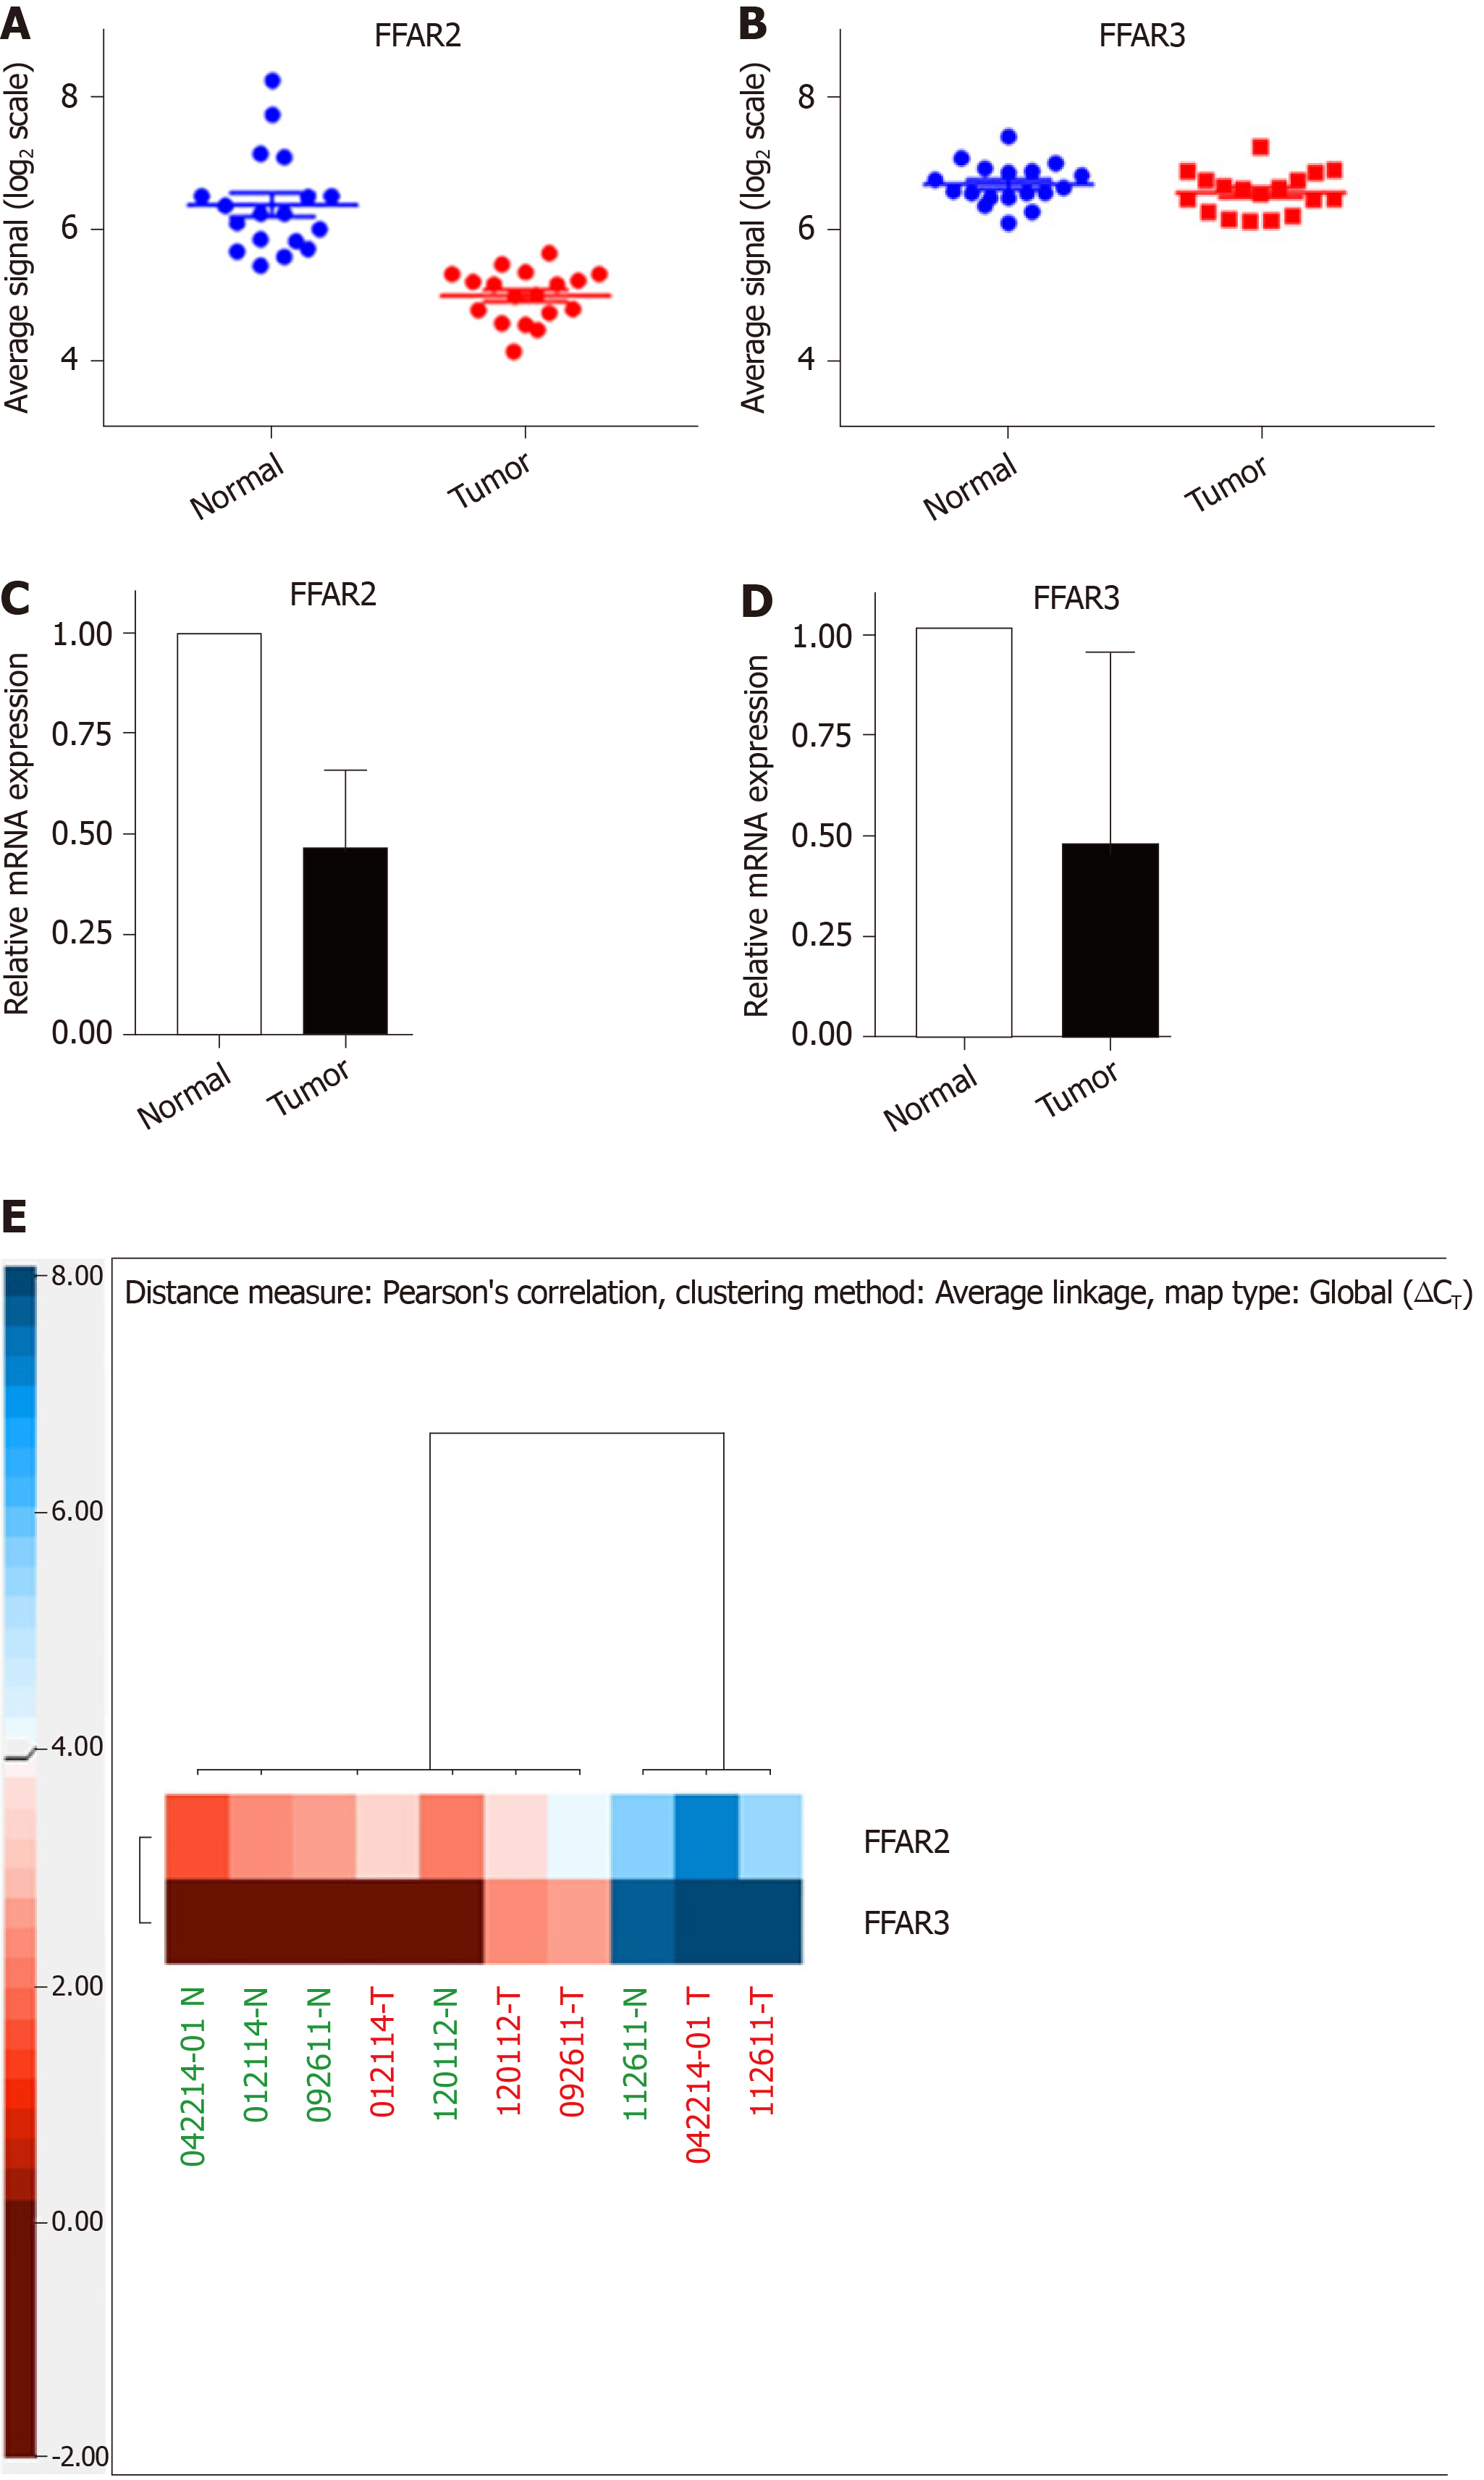
Figure 1 Gene expression analysis of free fatty acid receptor 2/3 genes in patients diagnosed with colorectal cancer.
A: Microarray analysis of gene expression of free fatty acid receptor (FFAR) 2 in tumor-normal paired tissues; B: Microarray analysis of gene expression of FFAR3 in tumor-normal paired tissues; C: Quantitative polymerase chain reaction (QPCR) gene expression analysis of FFAR2 in tumor-normal paired tissues; D: QPCR gene expression analysis of FFAR3 in tumor-normal paired tissues; E: Heatmap representation of FFAR2 and FFAR3 genes expression using QPCR in tumor-normal paired tissues. Color intensity ruler is given to represent Threshhold cycle (Ct) values with a range of -2 to 2 which is inverse of expression level. More red means less Ct and hence more expression. More blue reflects More Ct value suggesting less expression. Each bar represents an average of at least two independent experiments with multiple technical replicates in each experiment. Significance was set for a P value of < 0.05 (paired t test). FFAR: Free fatty acid receptor; Ct: Threshhold cycle.
- Citation: Al Mahri S, Al Ghamdi A, Akiel M, Al Aujan M, Mohammad S, Aziz MA. Free fatty acids receptors 2 and 3 control cell proliferation by regulating cellular glucose uptake. World J Gastrointest Oncol 2020; 12(5): 514-525
- URL: https://www.wjgnet.com/1948-5204/full/v12/i5/514.htm
- DOI: https://dx.doi.org/10.4251/wjgo.v12.i5.514


