Copyright
©The Author(s) 2020.
World J Gastrointest Oncol. Apr 15, 2020; 12(4): 447-456
Published online Apr 15, 2020. doi: 10.4251/wjgo.v12.i4.447
Published online Apr 15, 2020. doi: 10.4251/wjgo.v12.i4.447
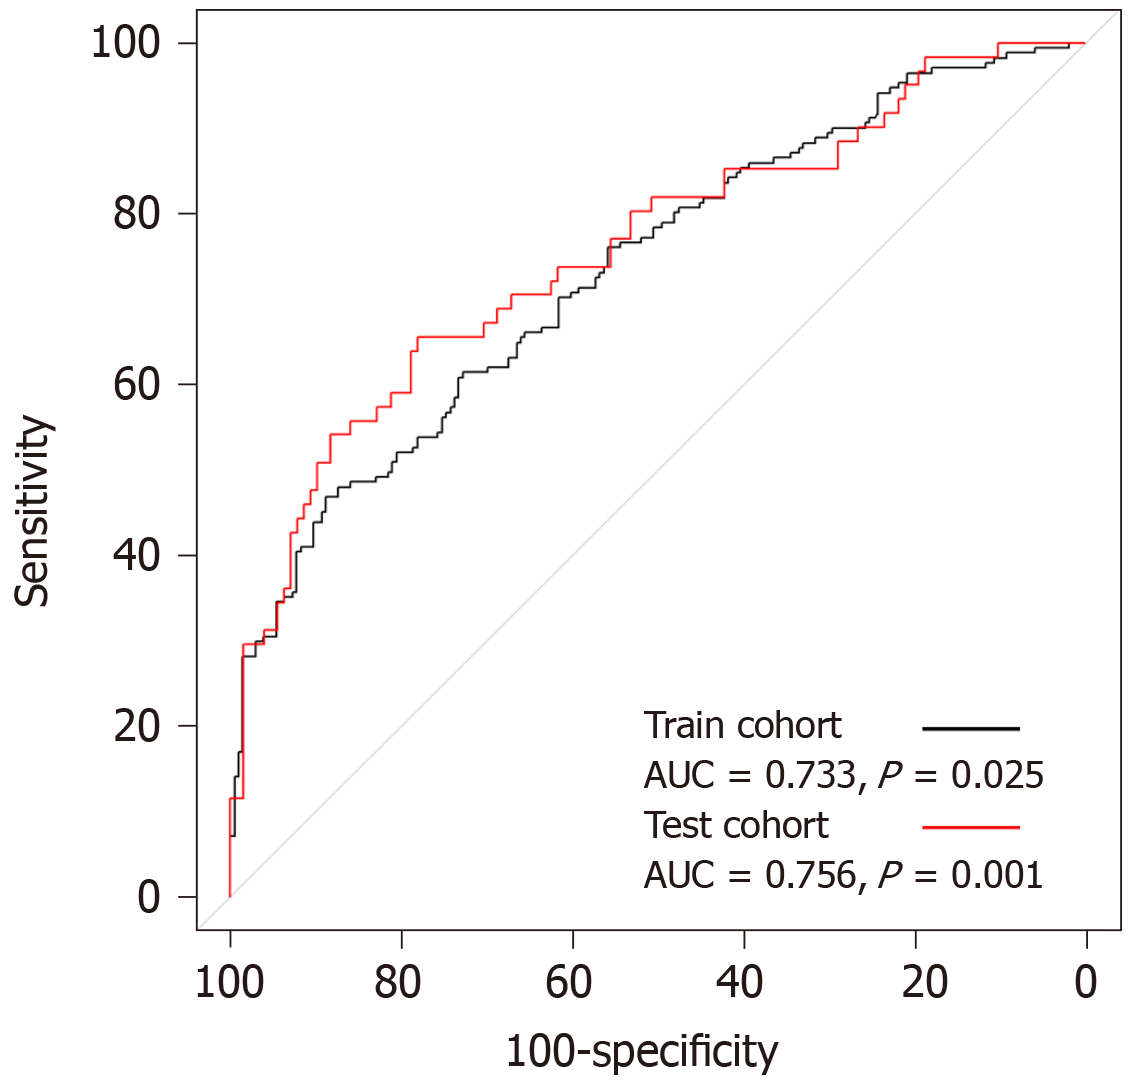
Figure 3 C-statistic of the combination model using metabolic parameters (maximum standardized uptake value of primary tumor and maximum standardized uptake value of lymph node) and laboratory findings (albumin and CA 19-9).
C-statistic using receiver operating characteristic curve analysis, the area under the curve was 0.733 (95%CI: 0.683–0.784, P = 0.025) for lymph node metastasis prediction performance in the training cohort (black line), and area under the curve was of 0.756 (95%CI: 0.678–0.833, P < 0.001) in the test cohort (red line). AUC: Area under the curve.
- Citation: Song BI. Nomogram using F-18 fluorodeoxyglucose positron emission tomography/computed tomography for preoperative prediction of lymph node metastasis in gastric cancer. World J Gastrointest Oncol 2020; 12(4): 447-456
- URL: https://www.wjgnet.com/1948-5204/full/v12/i4/447.htm
- DOI: https://dx.doi.org/10.4251/wjgo.v12.i4.447


