Copyright
©The Author(s) 2020.
World J Gastrointest Oncol. Mar 15, 2020; 12(3): 301-310
Published online Mar 15, 2020. doi: 10.4251/wjgo.v12.i3.301
Published online Mar 15, 2020. doi: 10.4251/wjgo.v12.i3.301
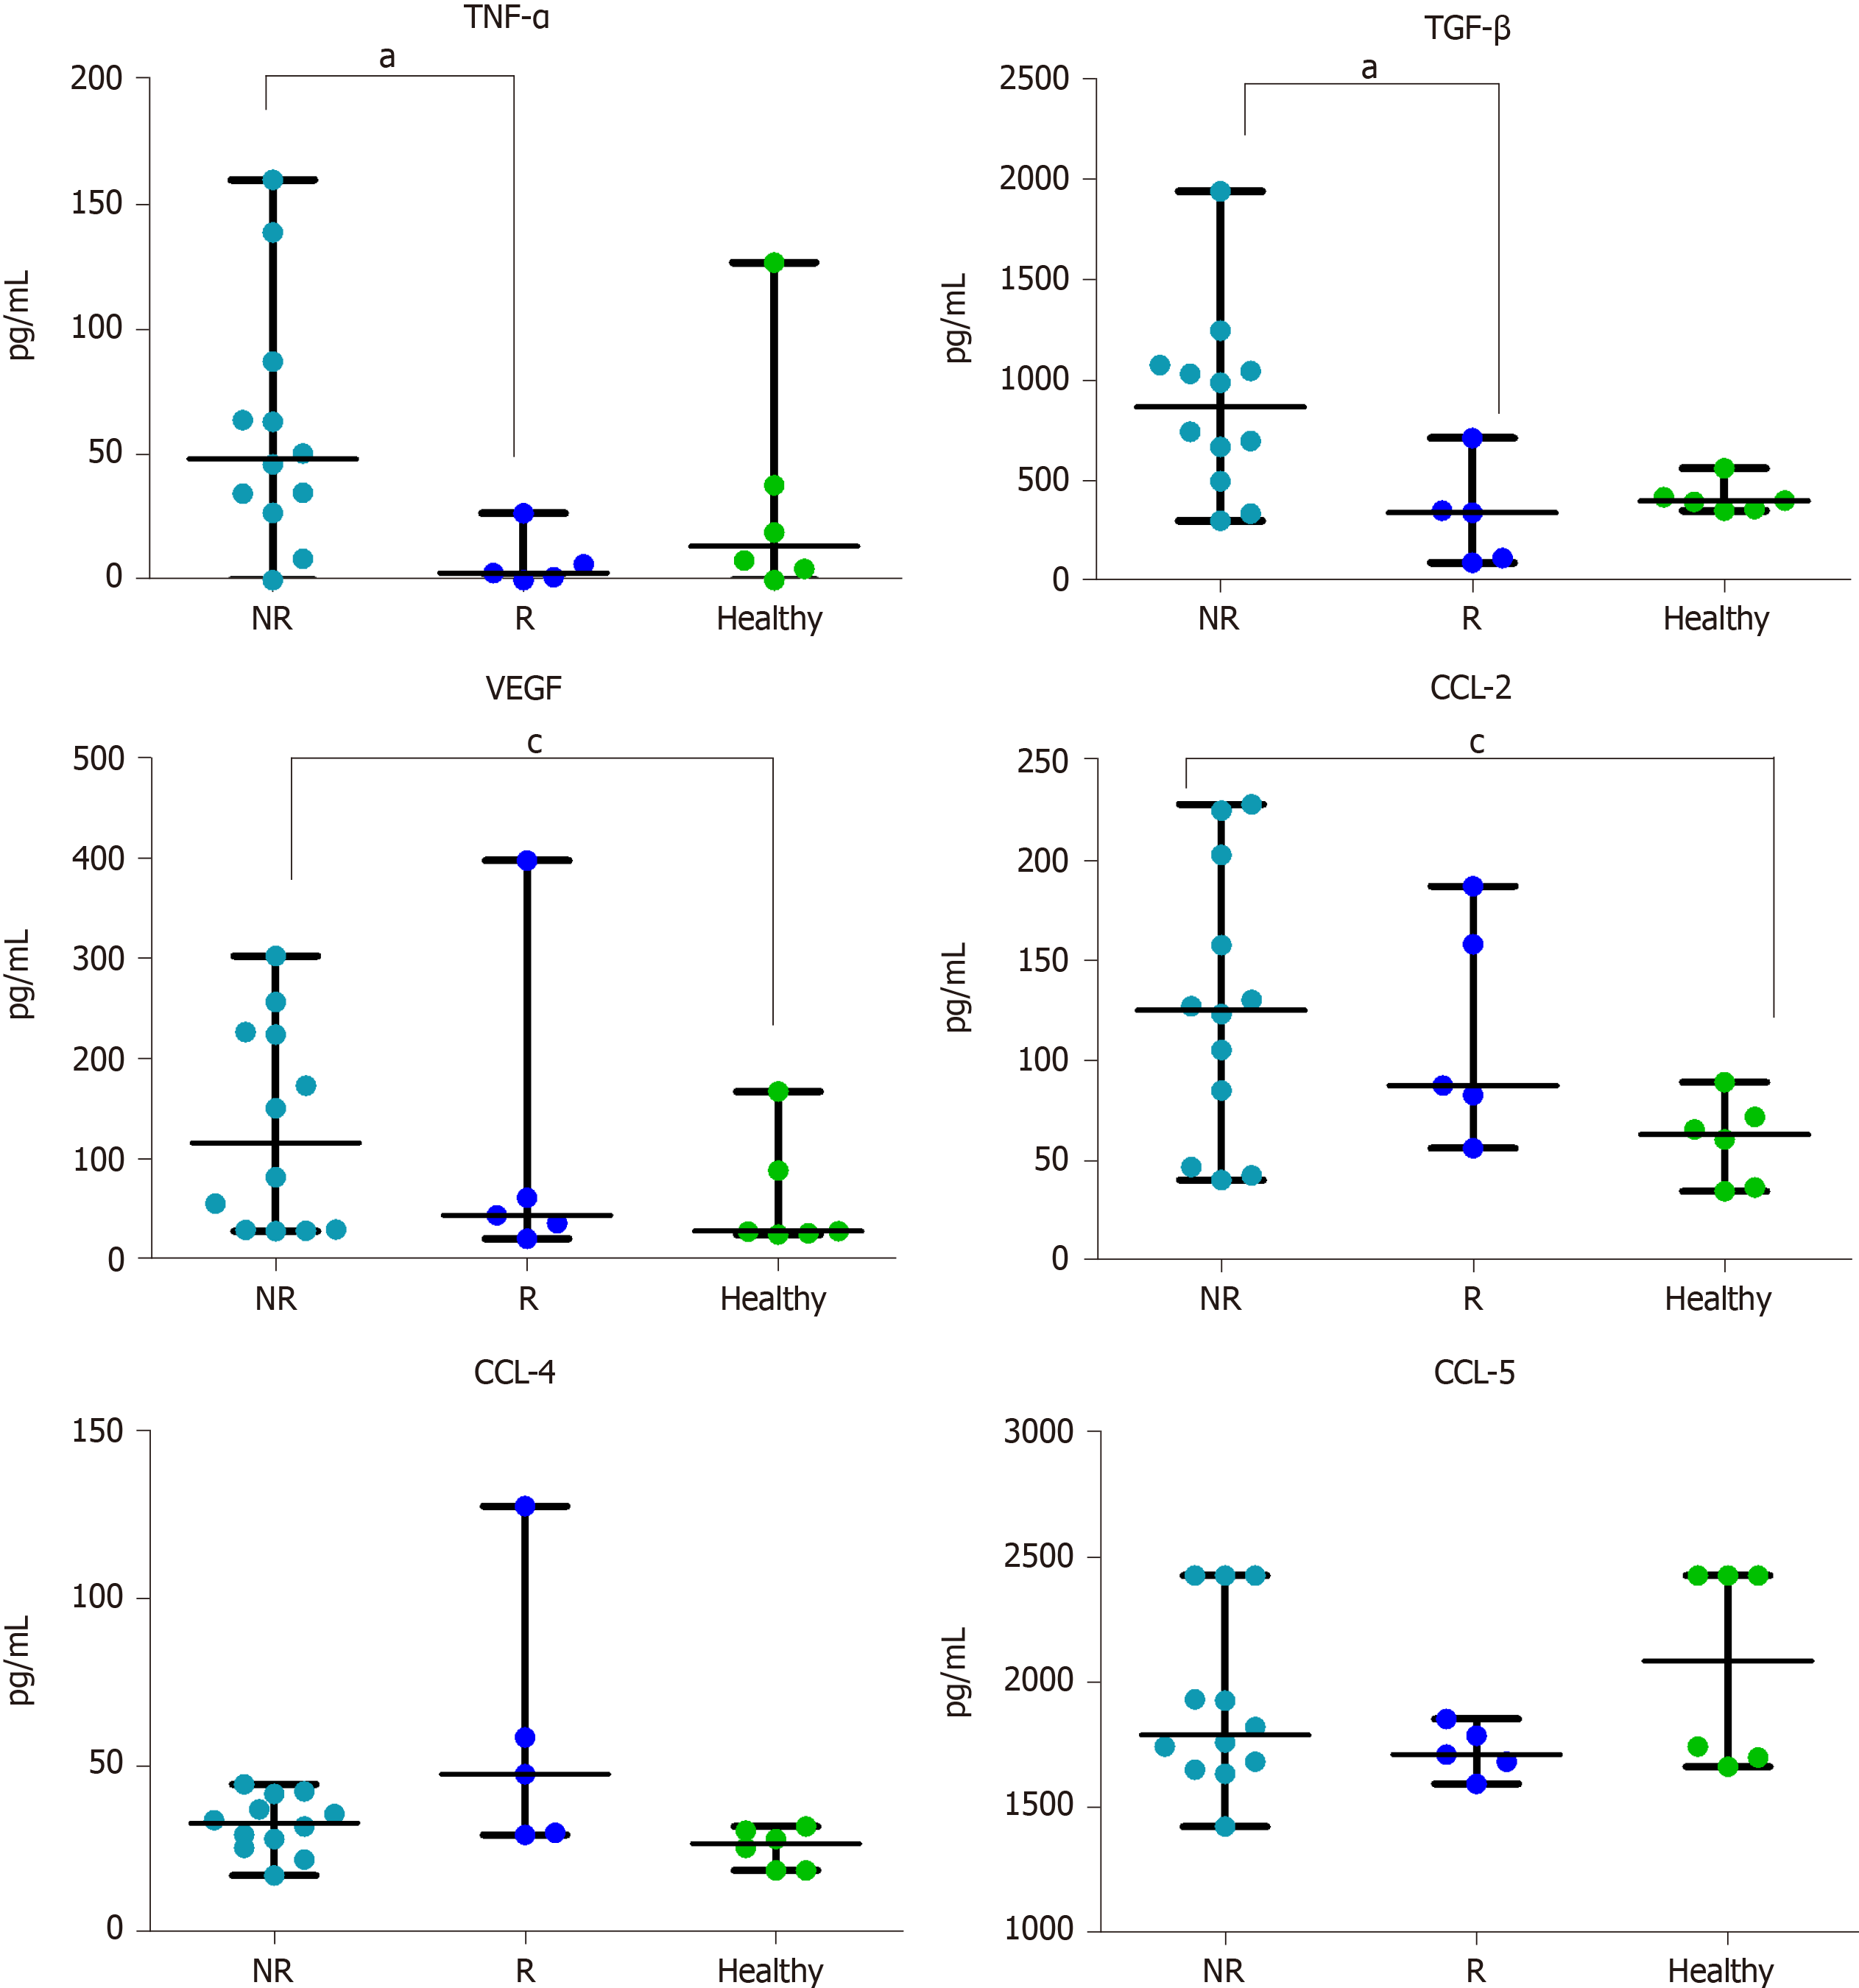
Figure 1 Plasma cytokines levels.
Basal evaluation of 6 cytokines in non-responder patients (n = 12), Responder patients (n = 5) and in healthy volunteers (n = 6). Cytokine concentration is expressed in pg/mL. Data are shown as median with range. The difference in median values was computed using the non-parametric Mann Whitney U test. P < 0.05 was considered the statistical significance. aP < 0.05 NR vs R; cP < 0.05 NR vs Healthy. NR: Non-responder; R: Responder; TNF-α: Tumor necrosis alpha; TGF-β: Transforming growth factor alpha; VEGF: Vascular endothelial growth factor; CCL-2: Chemokine ligand 2; CCL-4: Chemokine ligand 4; CCL-5: Chemokine ligand 5.
- Citation: Ricci V, Granetto C, Falletta A, Paccagnella M, Abbona A, Fea E, Fabozzi T, Lo Nigro C, Merlano MC. Circulating cytokines and outcome in metastatic colorectal cancer patients treated with regorafenib. World J Gastrointest Oncol 2020; 12(3): 301-310
- URL: https://www.wjgnet.com/1948-5204/full/v12/i3/301.htm
- DOI: https://dx.doi.org/10.4251/wjgo.v12.i3.301


