Copyright
©The Author(s) 2020.
World J Gastrointest Oncol. Mar 15, 2020; 12(3): 248-266
Published online Mar 15, 2020. doi: 10.4251/wjgo.v12.i3.248
Published online Mar 15, 2020. doi: 10.4251/wjgo.v12.i3.248
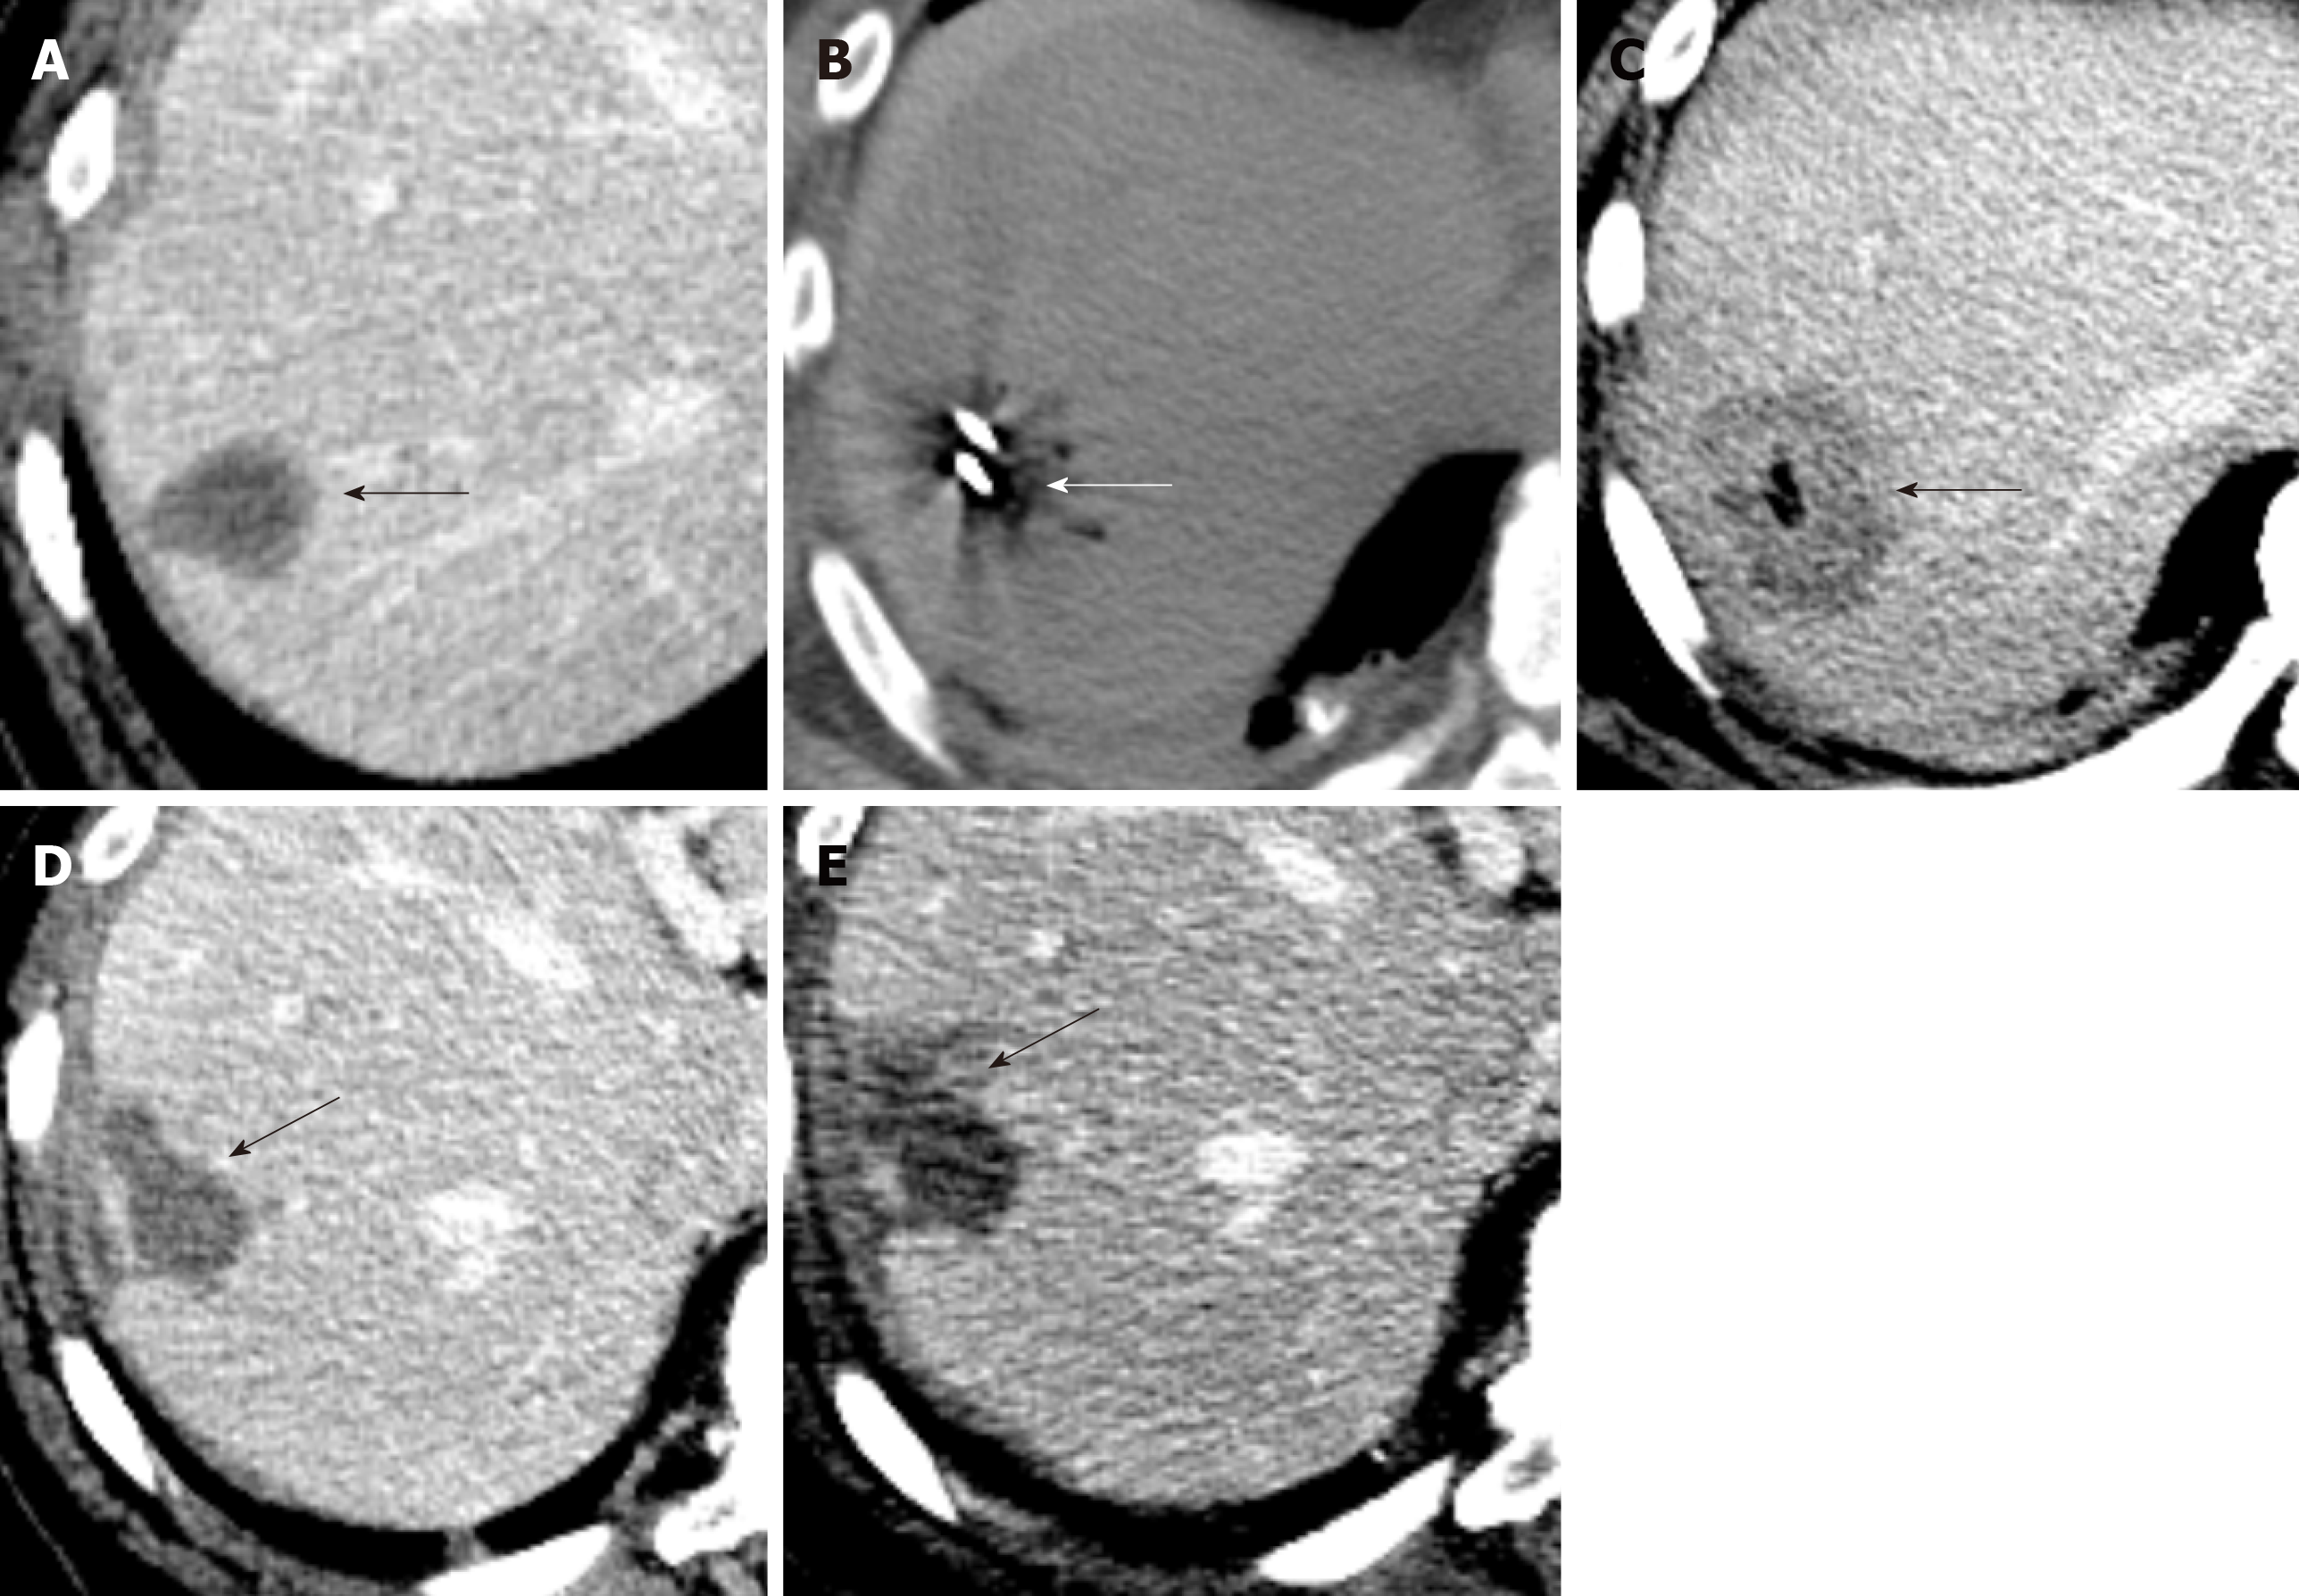
Figure 8 Ablation of hepatic hemangioepithelioma.
A: Axial contrast enhanced CT image shows a 3 cm hepatic hemangioepithelioma nodule (arrow) in segment 7 of the liver; B: Axial non-contrast CT image shows microwave ablation of liver of the segment 7 nodule (arrow); C: Immediate post ablation axial contrast enhanced CT image shows an ablation cavity (arrow); D: Follow up axial contrast CT image after 3 mo and; E: Axial contrast CT image 6 mo show an evolving post ablation cavity and tract (arrow).
- Citation: Virarkar M, Saleh M, Diab R, Taggart M, Bhargava P, Bhosale P. Hepatic Hemangioendothelioma: An update. World J Gastrointest Oncol 2020; 12(3): 248-266
- URL: https://www.wjgnet.com/1948-5204/full/v12/i3/248.htm
- DOI: https://dx.doi.org/10.4251/wjgo.v12.i3.248


