Copyright
©The Author(s) 2020.
World J Gastrointest Oncol. Mar 15, 2020; 12(3): 248-266
Published online Mar 15, 2020. doi: 10.4251/wjgo.v12.i3.248
Published online Mar 15, 2020. doi: 10.4251/wjgo.v12.i3.248
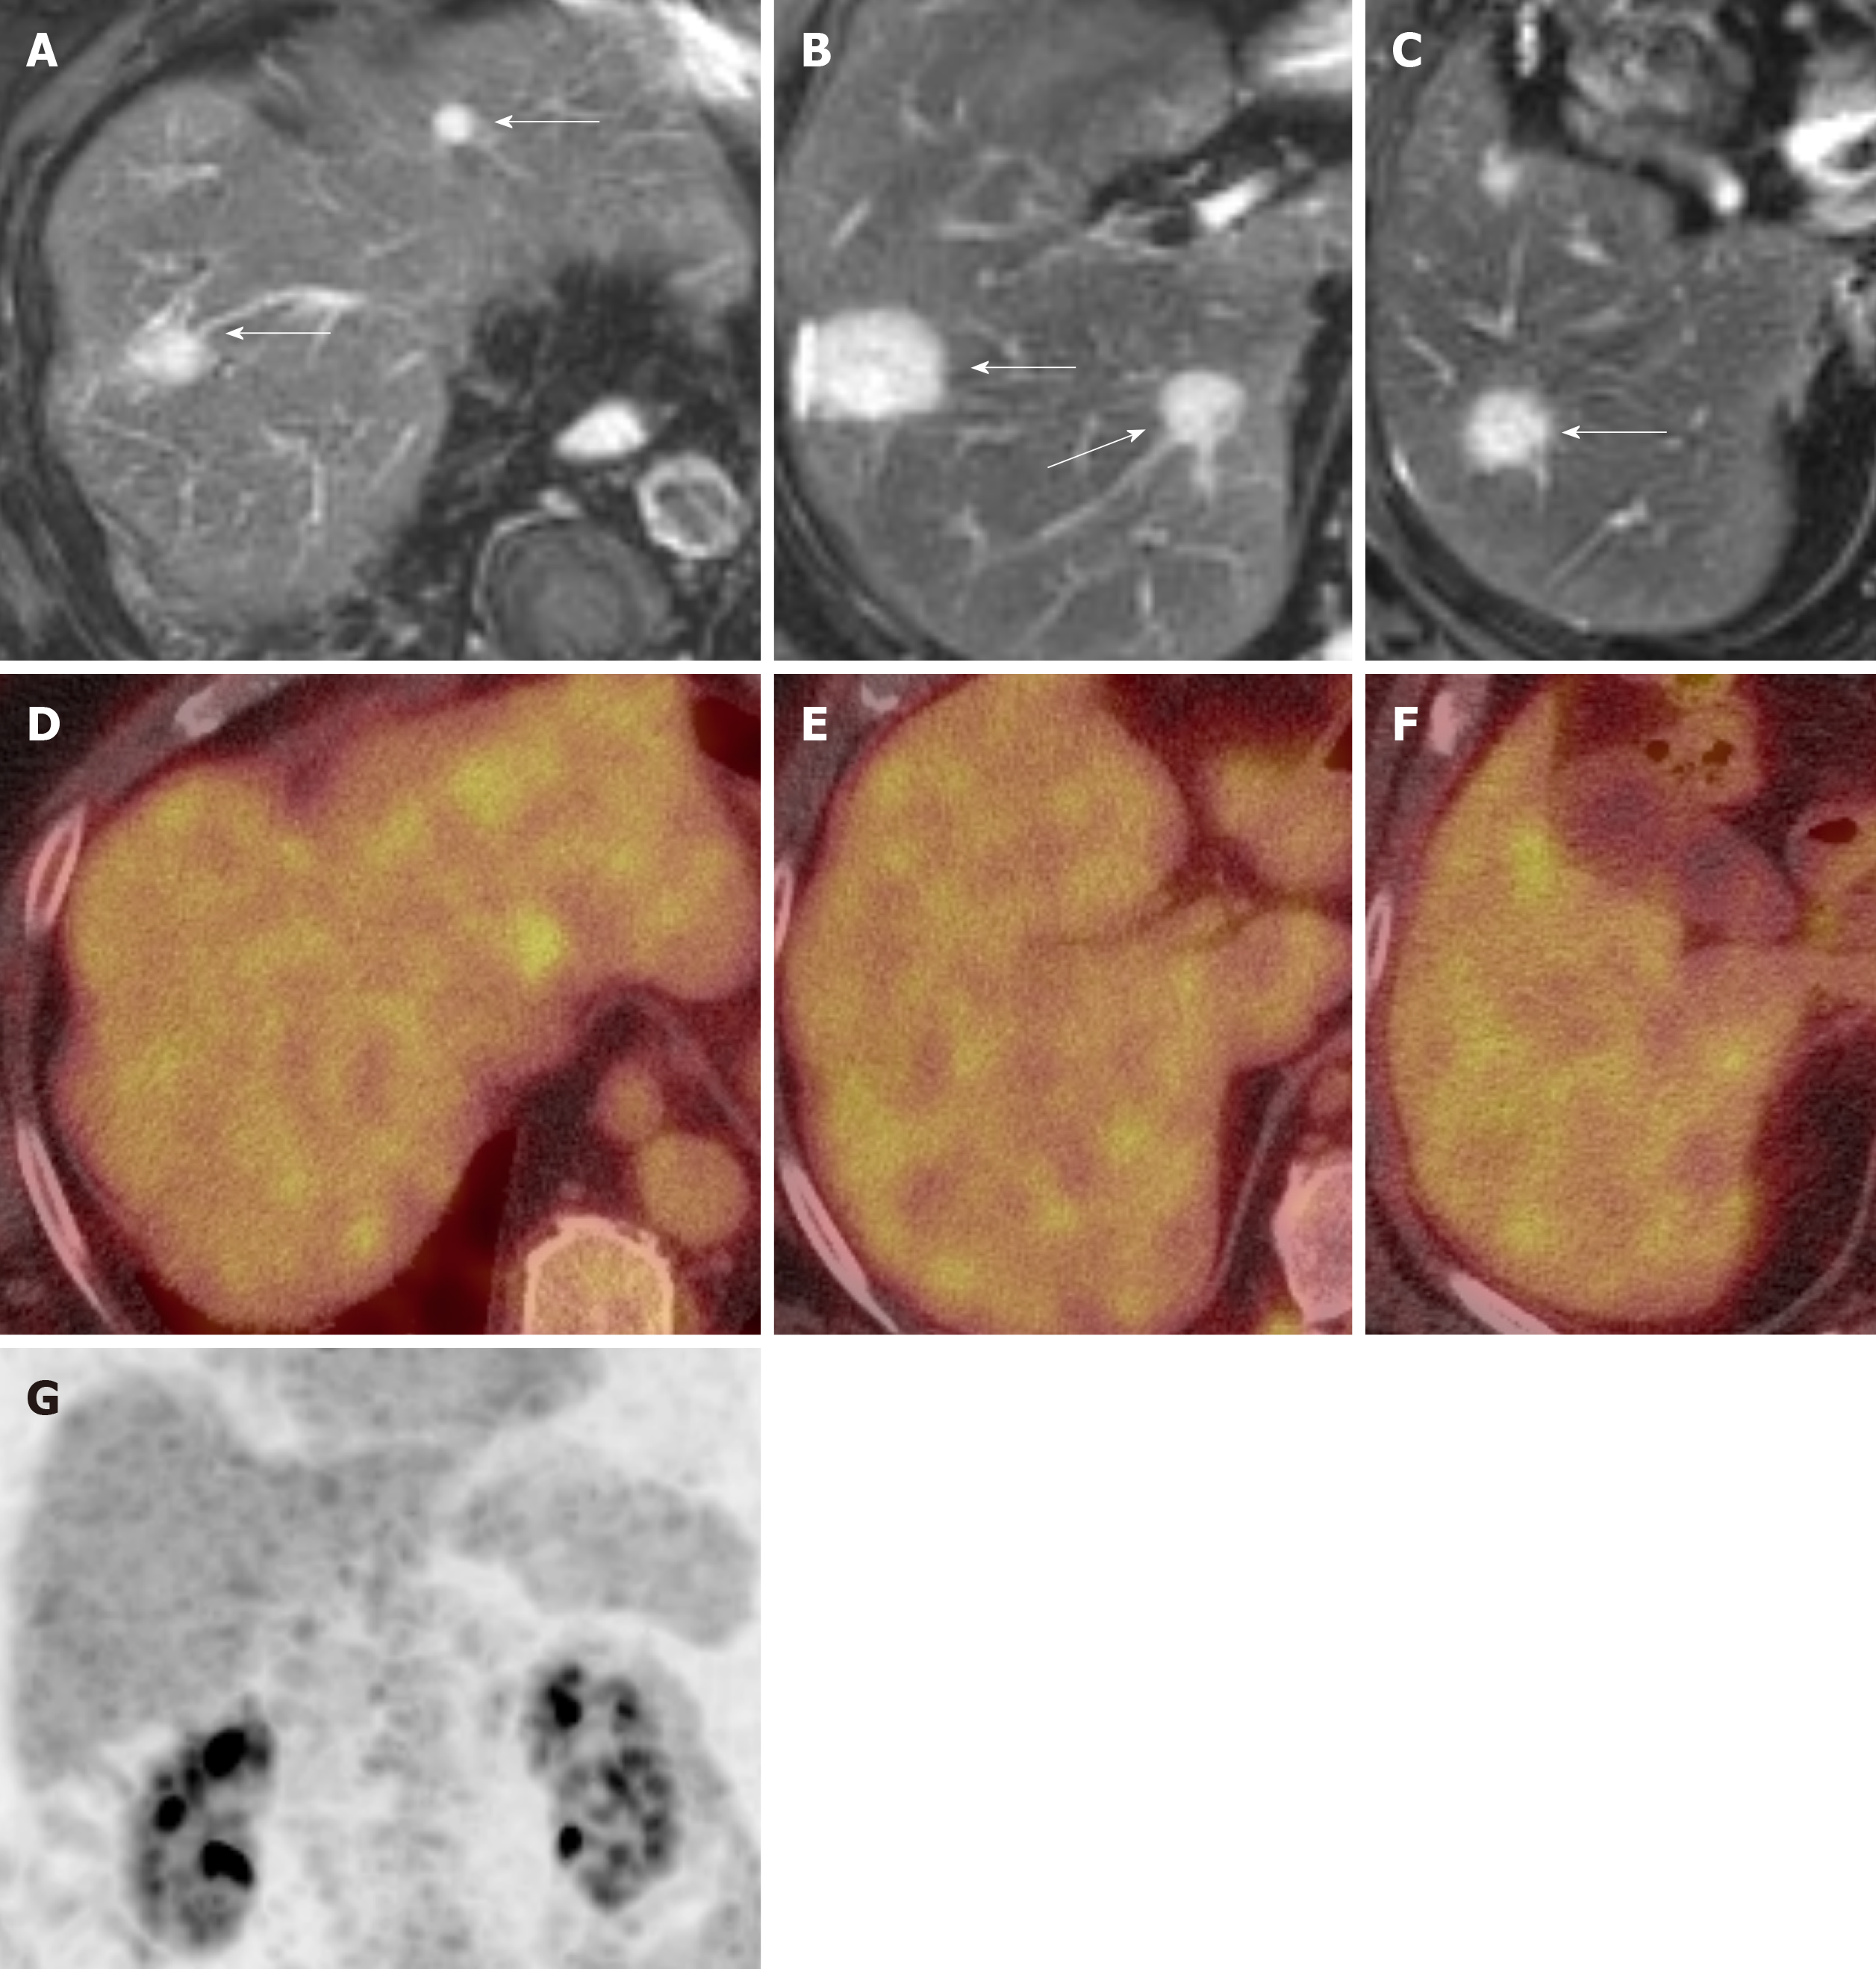
Figure 5 Imaging of hepatic hemangioepithelioma.
A, B and C: Axial T2 Weighted Image Magnetic Resonance Imaging images show hepatic hemangioepithelioma nodules (arrows); D, E and F: Axial 18F-labeled fluoro-2-deoxyglucose positron emission tomography/computed tomography and G: Coronal maximum intensity projection images show no fluoro-2-deoxyglucose update by the hepatic hemangioepithelioma nodules.
- Citation: Virarkar M, Saleh M, Diab R, Taggart M, Bhargava P, Bhosale P. Hepatic Hemangioendothelioma: An update. World J Gastrointest Oncol 2020; 12(3): 248-266
- URL: https://www.wjgnet.com/1948-5204/full/v12/i3/248.htm
- DOI: https://dx.doi.org/10.4251/wjgo.v12.i3.248


