Copyright
©The Author(s) 2020.
World J Gastrointest Oncol. Mar 15, 2020; 12(3): 248-266
Published online Mar 15, 2020. doi: 10.4251/wjgo.v12.i3.248
Published online Mar 15, 2020. doi: 10.4251/wjgo.v12.i3.248
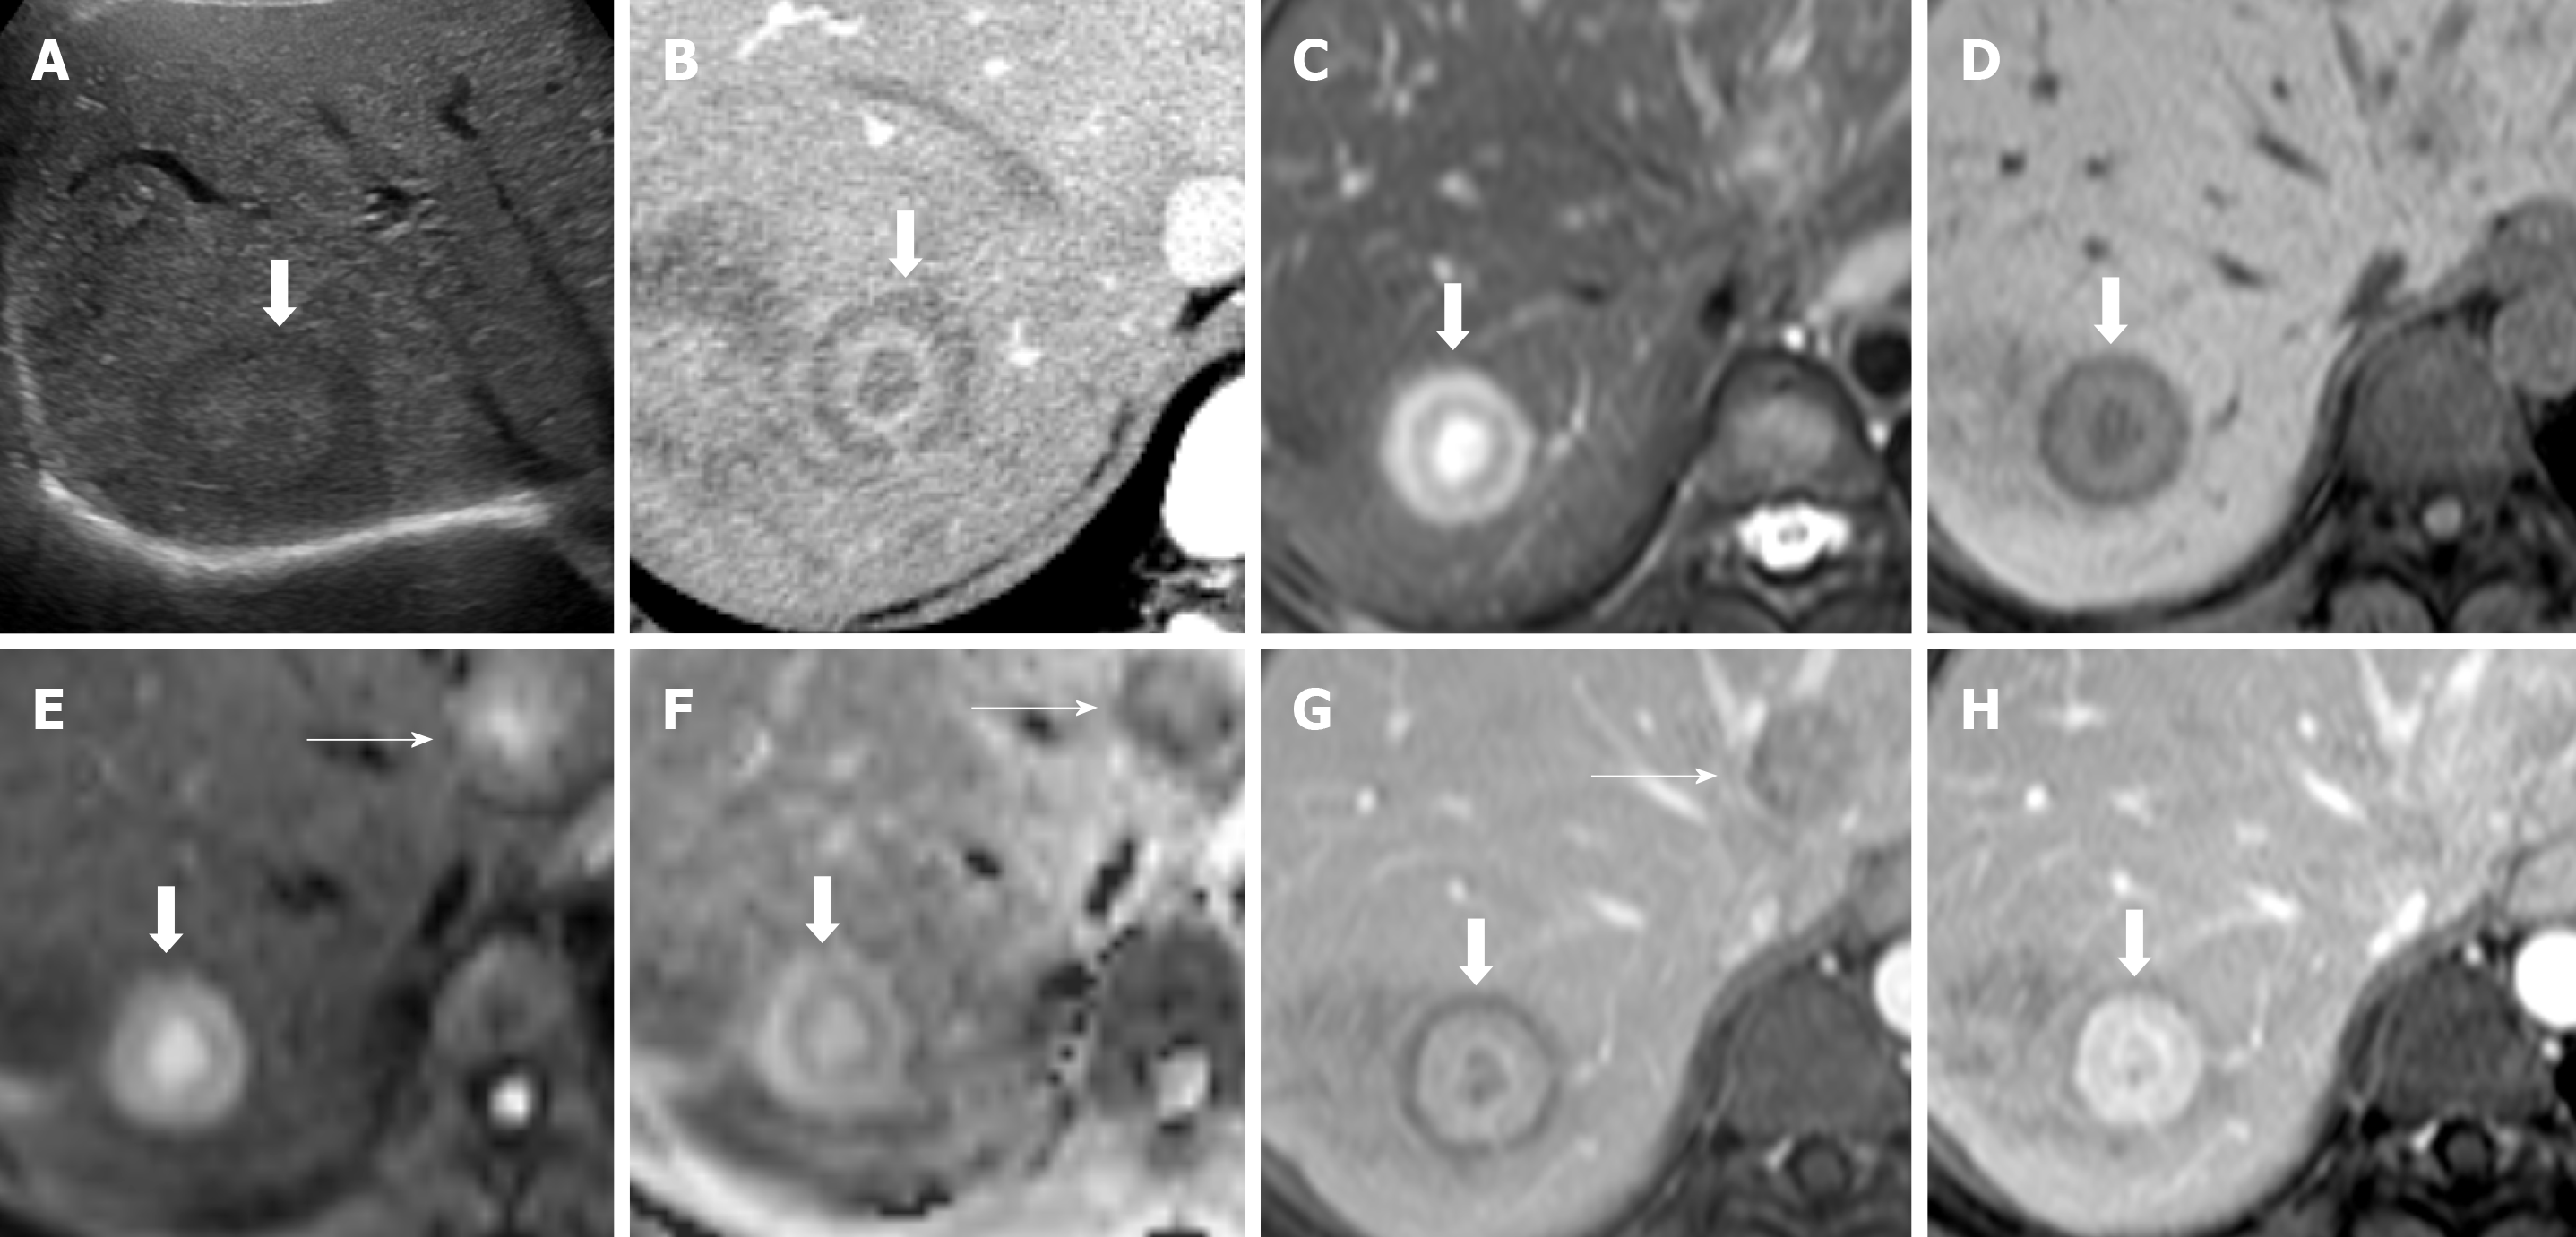
Figure 2 Hepatic hemangioepithelioma imaging feature.
A: Transverse ultrasound of the right upper abdomen reveals a iso to mildly hypoechoic lesion (arrow) in the liver; B: Axial contrast enhanced CT image of the liver; C: Axial T2 weighted images (T2WI); D: Axial pre contrast T1 weighted images (T1WI); E: Axial diffusion weighted image (DWI); F: Apparent diffusion coefficient; G: Axial post contrast T1WI portovenous; and H: Axial post contrast T1WI venous magnetic resonance imaging (MRI) images. On T2WI, a target appearance consists of a core with high signal intensity (similar to fluid), a thin ring with low signal intensity, and a peripheral halo with slight hyperintense signal (thick arrows). On dynamic study, it consists of an hypodense/hypointense core, surrounded by a layer of enhancement and a thin peripheral hypodense/hypointense halo (thick arrows). Other hepatic hemangioepithelioma nodules are also noted (thin nodules). T2WI: T2 Weighted Images; T1WI: T1 weighted images; DWI: diffusion weighted image; MRI: Magnetic resonance imaging.
- Citation: Virarkar M, Saleh M, Diab R, Taggart M, Bhargava P, Bhosale P. Hepatic Hemangioendothelioma: An update. World J Gastrointest Oncol 2020; 12(3): 248-266
- URL: https://www.wjgnet.com/1948-5204/full/v12/i3/248.htm
- DOI: https://dx.doi.org/10.4251/wjgo.v12.i3.248


