Copyright
©The Author(s) 2020.
World J Gastrointest Oncol. Feb 15, 2020; 12(2): 219-227
Published online Feb 15, 2020. doi: 10.4251/wjgo.v12.i2.219
Published online Feb 15, 2020. doi: 10.4251/wjgo.v12.i2.219
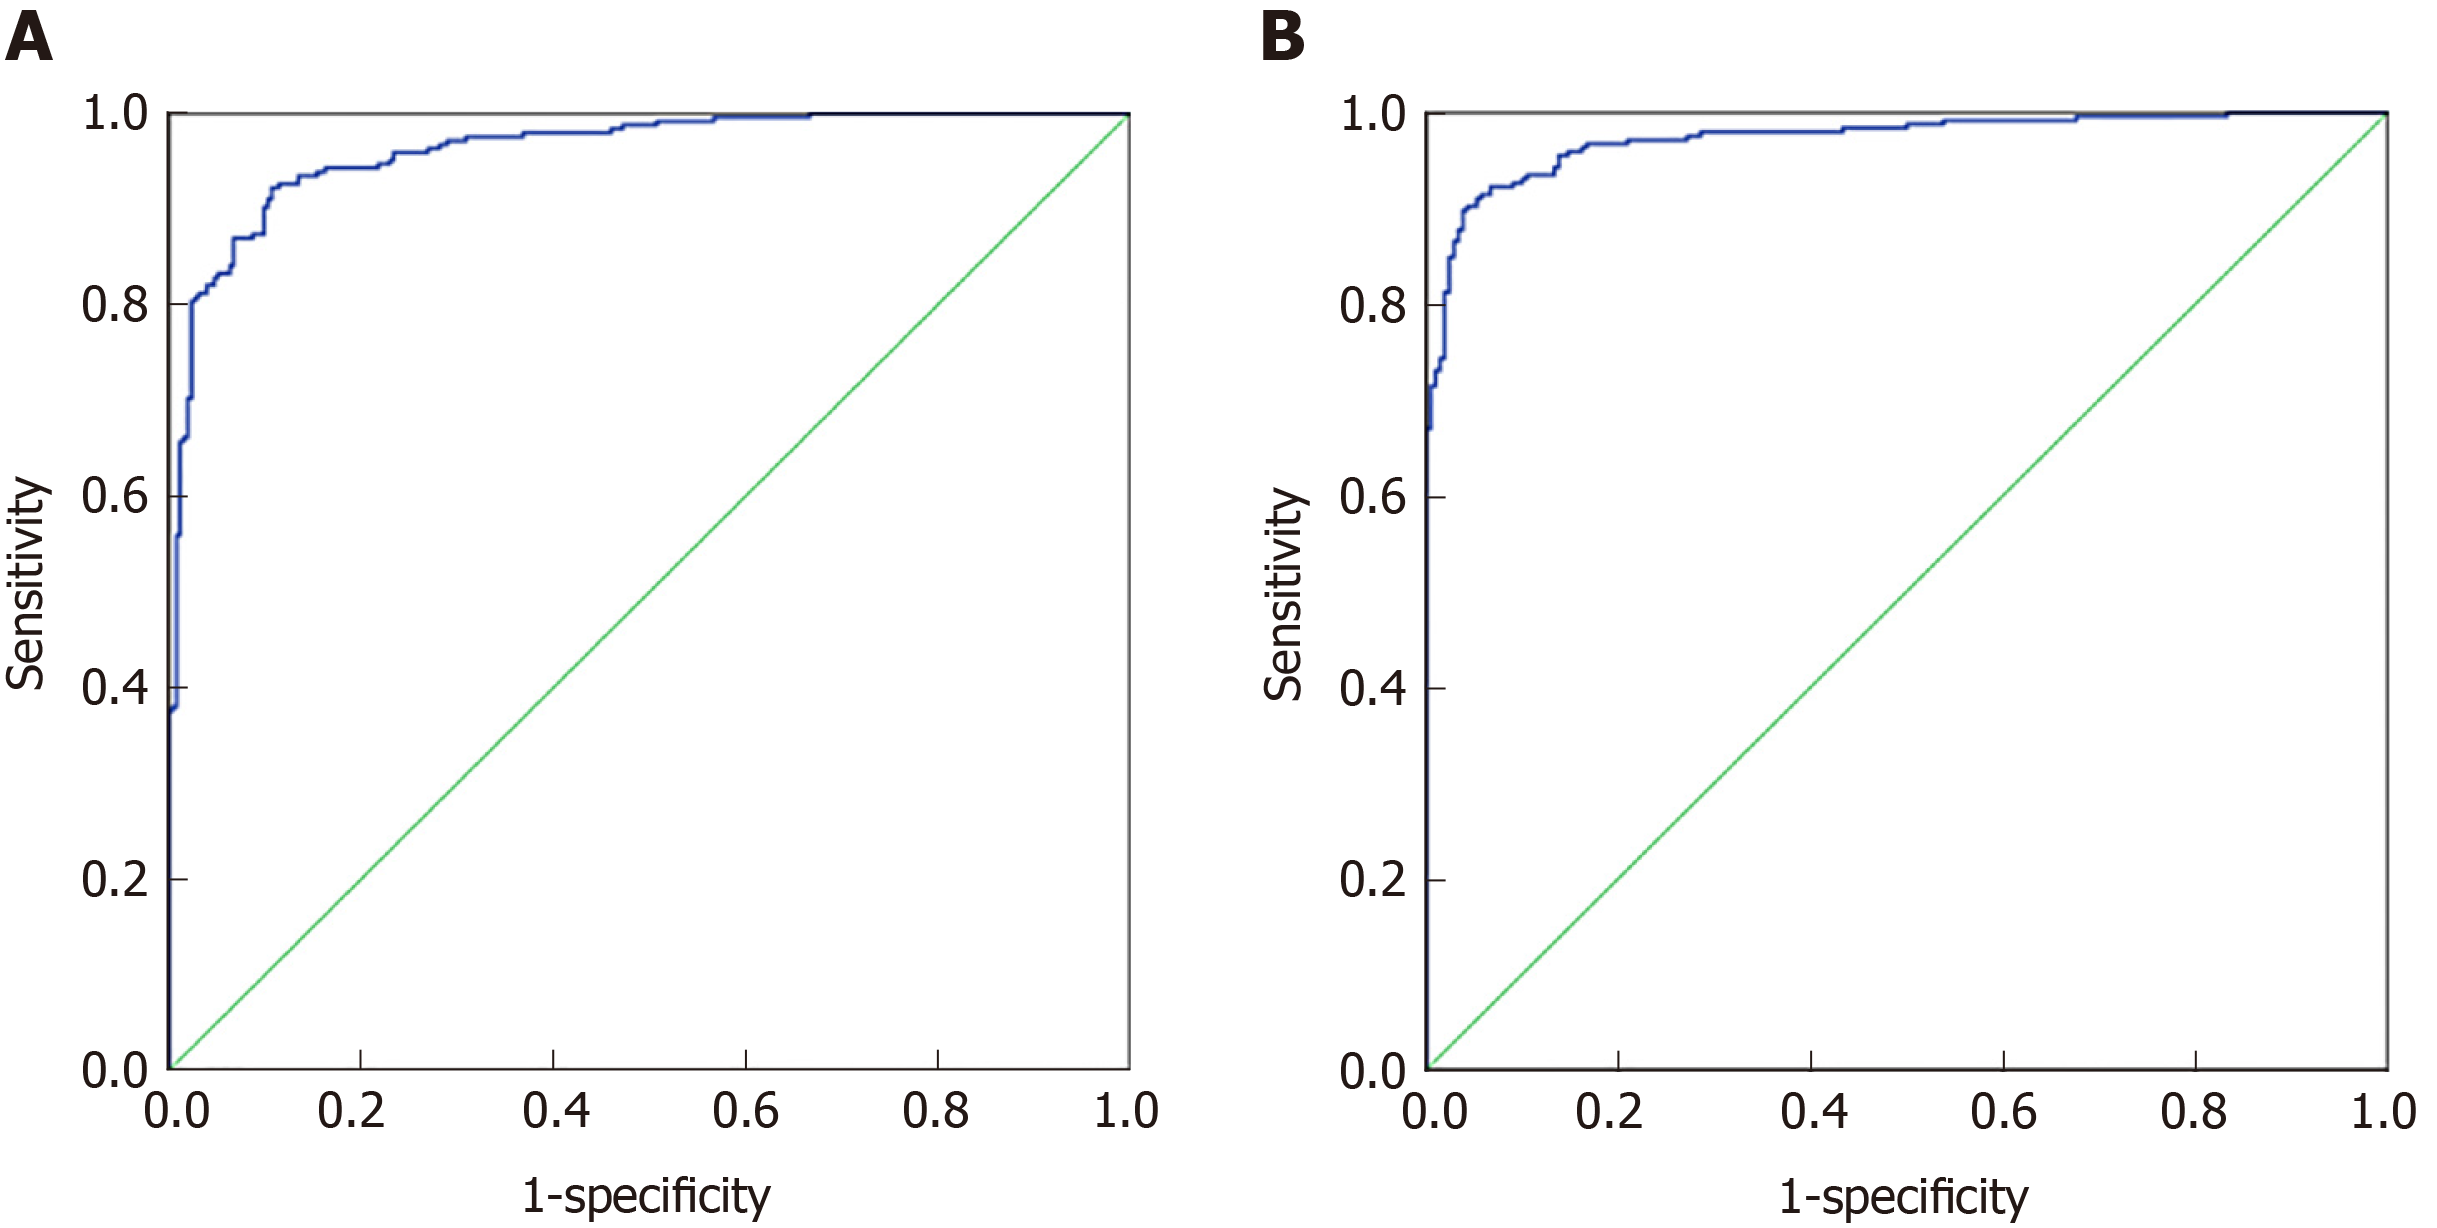
Figure 2 Discriminant analysis results of colorectal cancer and healthy control group, malignant disease group and benign disease group.
A: ROC curve of the discriminant analysis model of the colorectal cancer and healthy control group, respectively; B: ROC curve of the discriminant analysis model of the colorectal cancer and healthy control group.
- Citation: Song WY, Zhang X, Zhang Q, Zhang PJ, Zhang R. Clinical value evaluation of serum markers for early diagnosis of colorectal cancer. World J Gastrointest Oncol 2020; 12(2): 219-227
- URL: https://www.wjgnet.com/1948-5204/full/v12/i2/219.htm
- DOI: https://dx.doi.org/10.4251/wjgo.v12.i2.219


