Copyright
©The Author(s) 2020.
World J Gastrointest Oncol. Nov 15, 2020; 12(11): 1216-1236
Published online Nov 15, 2020. doi: 10.4251/wjgo.v12.i11.1216
Published online Nov 15, 2020. doi: 10.4251/wjgo.v12.i11.1216
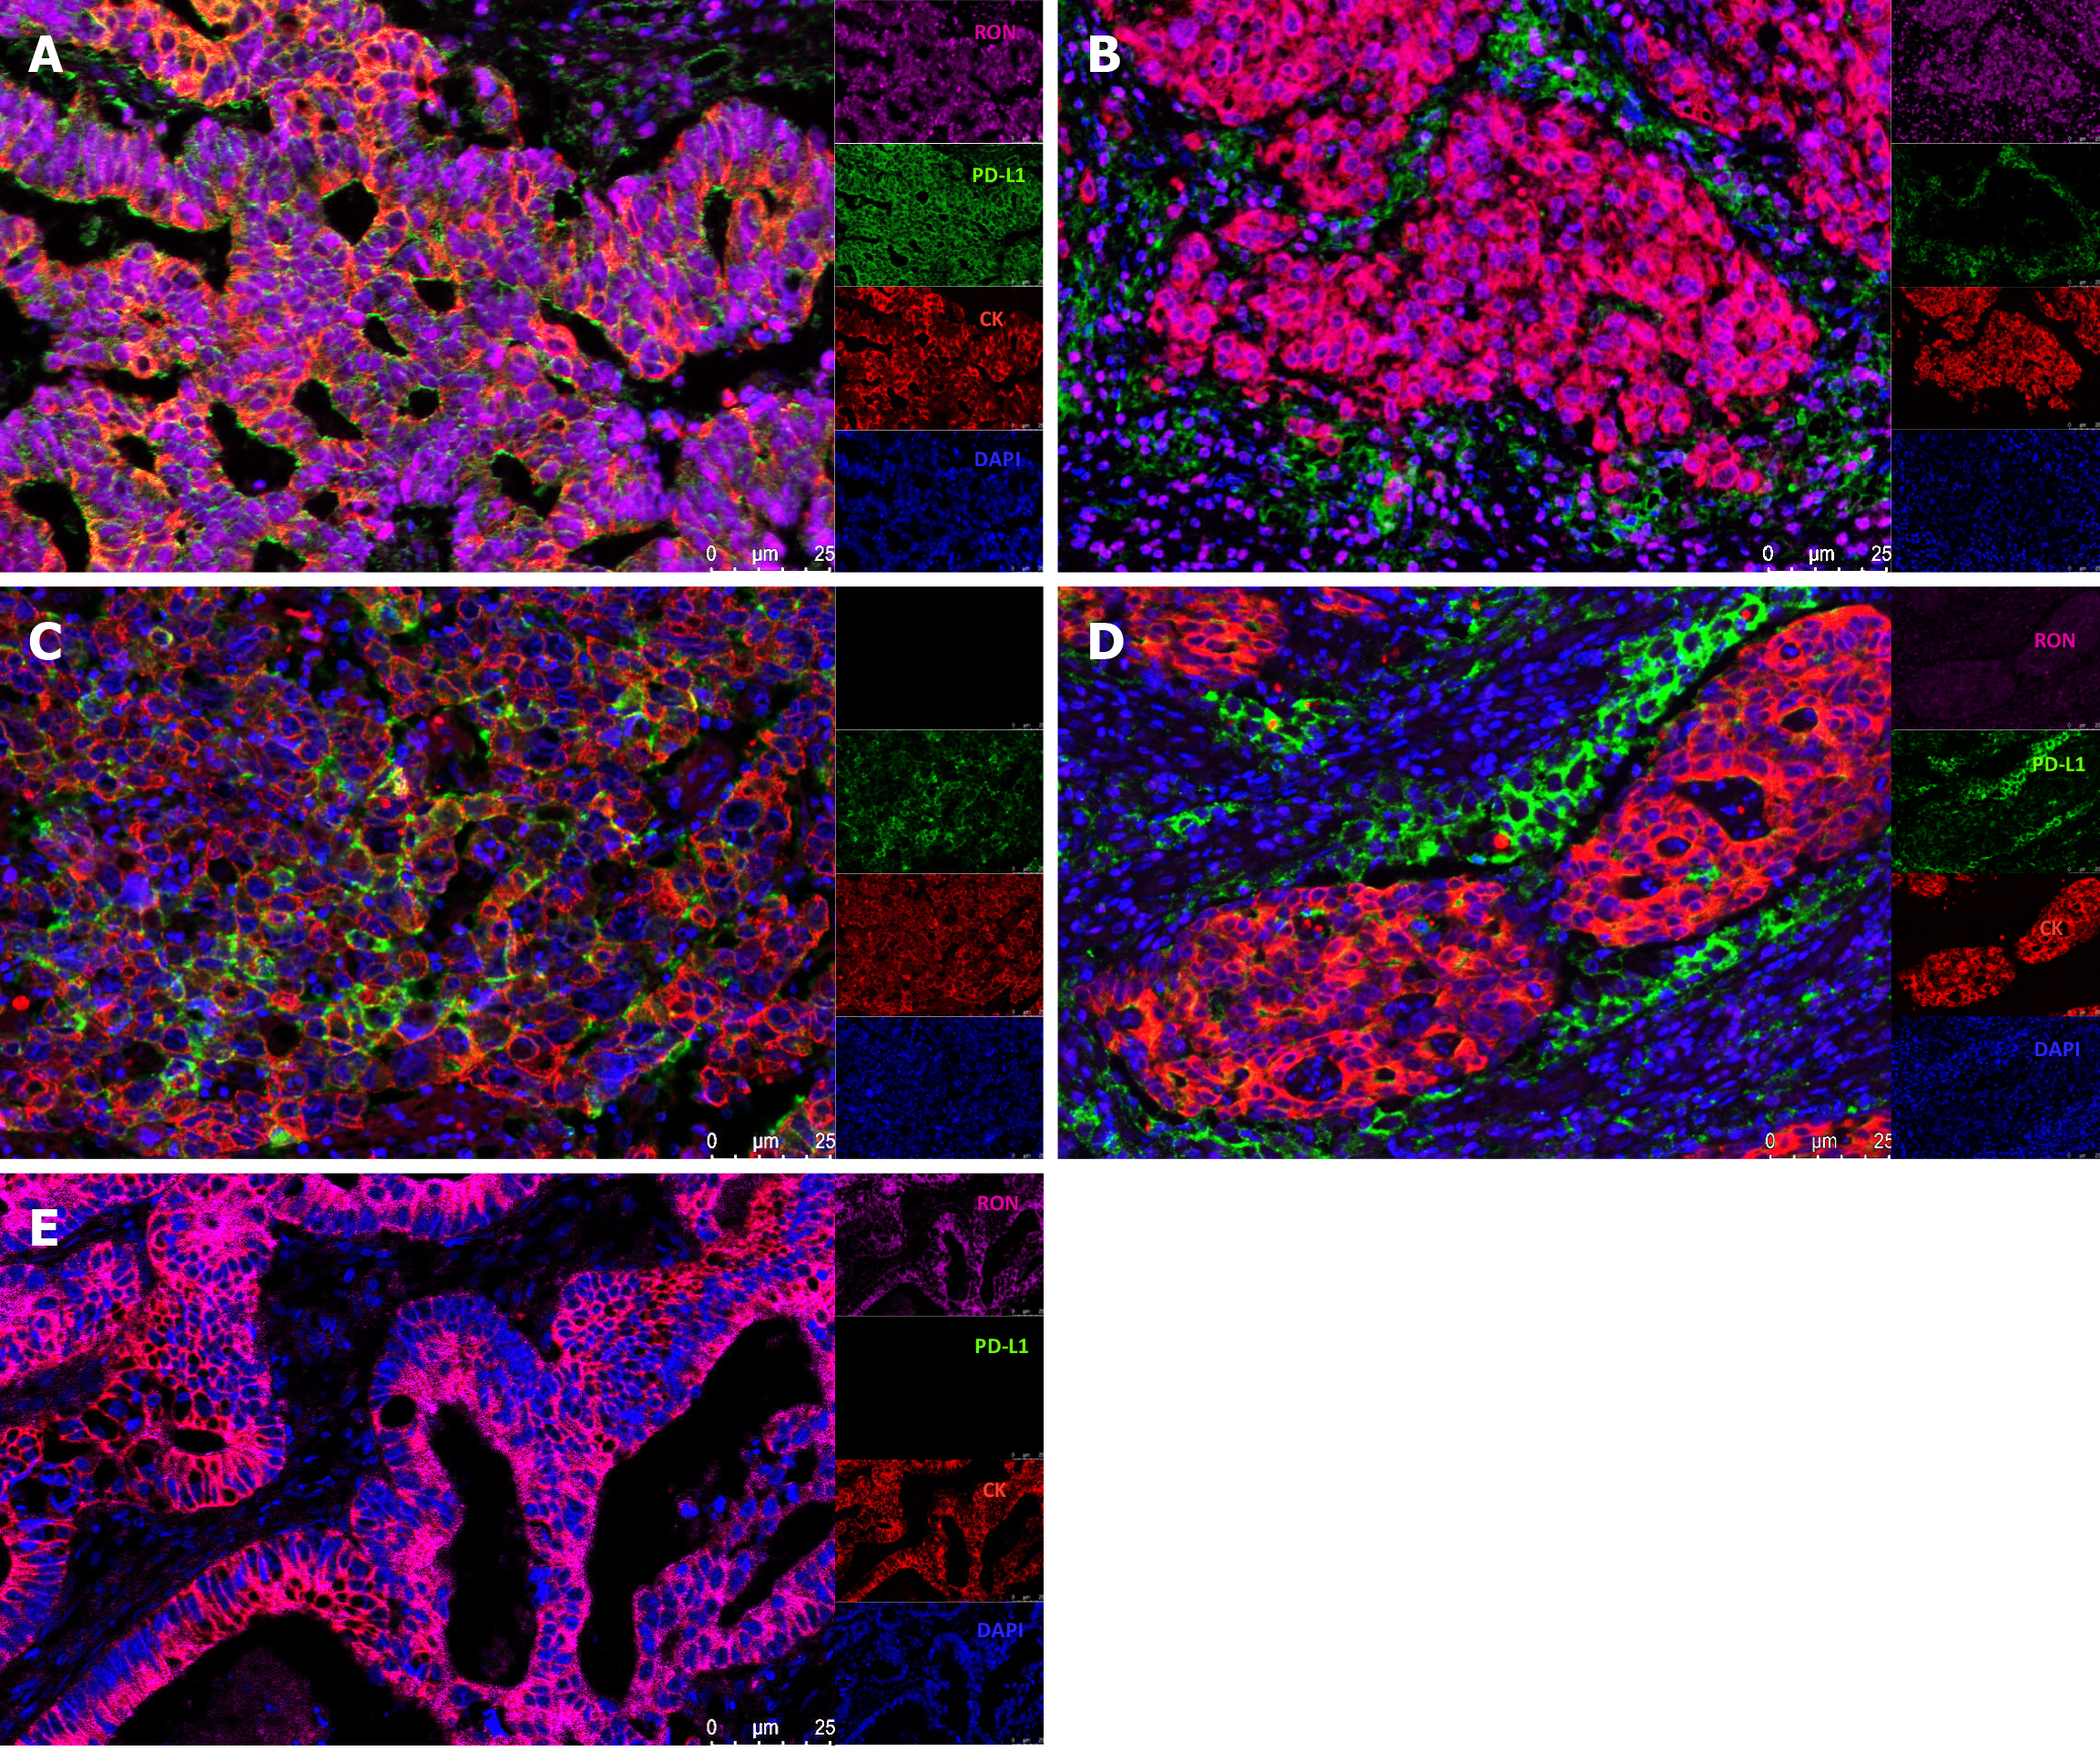
Figure 2 Four-color multiplex immunofluorescence staining of paraffin-embedded colorectal cancer tissues.
A: High expression of RON and PD-L1 in tumor cells (TCs); B: High expression of RON in TCs and high expression of PD-L1 in tumor-infiltrating mononuclear cells (TIMCs); C: Lack of RON expression and high PD-L1 expression in TCs; D: Low expression of RON in TC and high PD-L1 expression in TIMCs; E: High RON expression in TCs and no PD-L1 expression in either TCs or TIMCs. Blue (DAPI) shows nuclei, green shows PD-L1, pink indicates RON, and red displays CK.
- Citation: Liu YZ, Han DT, Shi DR, Hong B, Qian Y, Wu ZG, Yao SH, Tang TM, Wang MH, Xu XM, Yao HP. Pathological significance of abnormal recepteur d’origine nantais and programmed death ligand 1 expression in colorectal cancer. World J Gastrointest Oncol 2020; 12(11): 1216-1236
- URL: https://www.wjgnet.com/1948-5204/full/v12/i11/1216.htm
- DOI: https://dx.doi.org/10.4251/wjgo.v12.i11.1216


