Copyright
©The Author(s) 2020.
World J Gastrointest Oncol. Nov 15, 2020; 12(11): 1216-1236
Published online Nov 15, 2020. doi: 10.4251/wjgo.v12.i11.1216
Published online Nov 15, 2020. doi: 10.4251/wjgo.v12.i11.1216
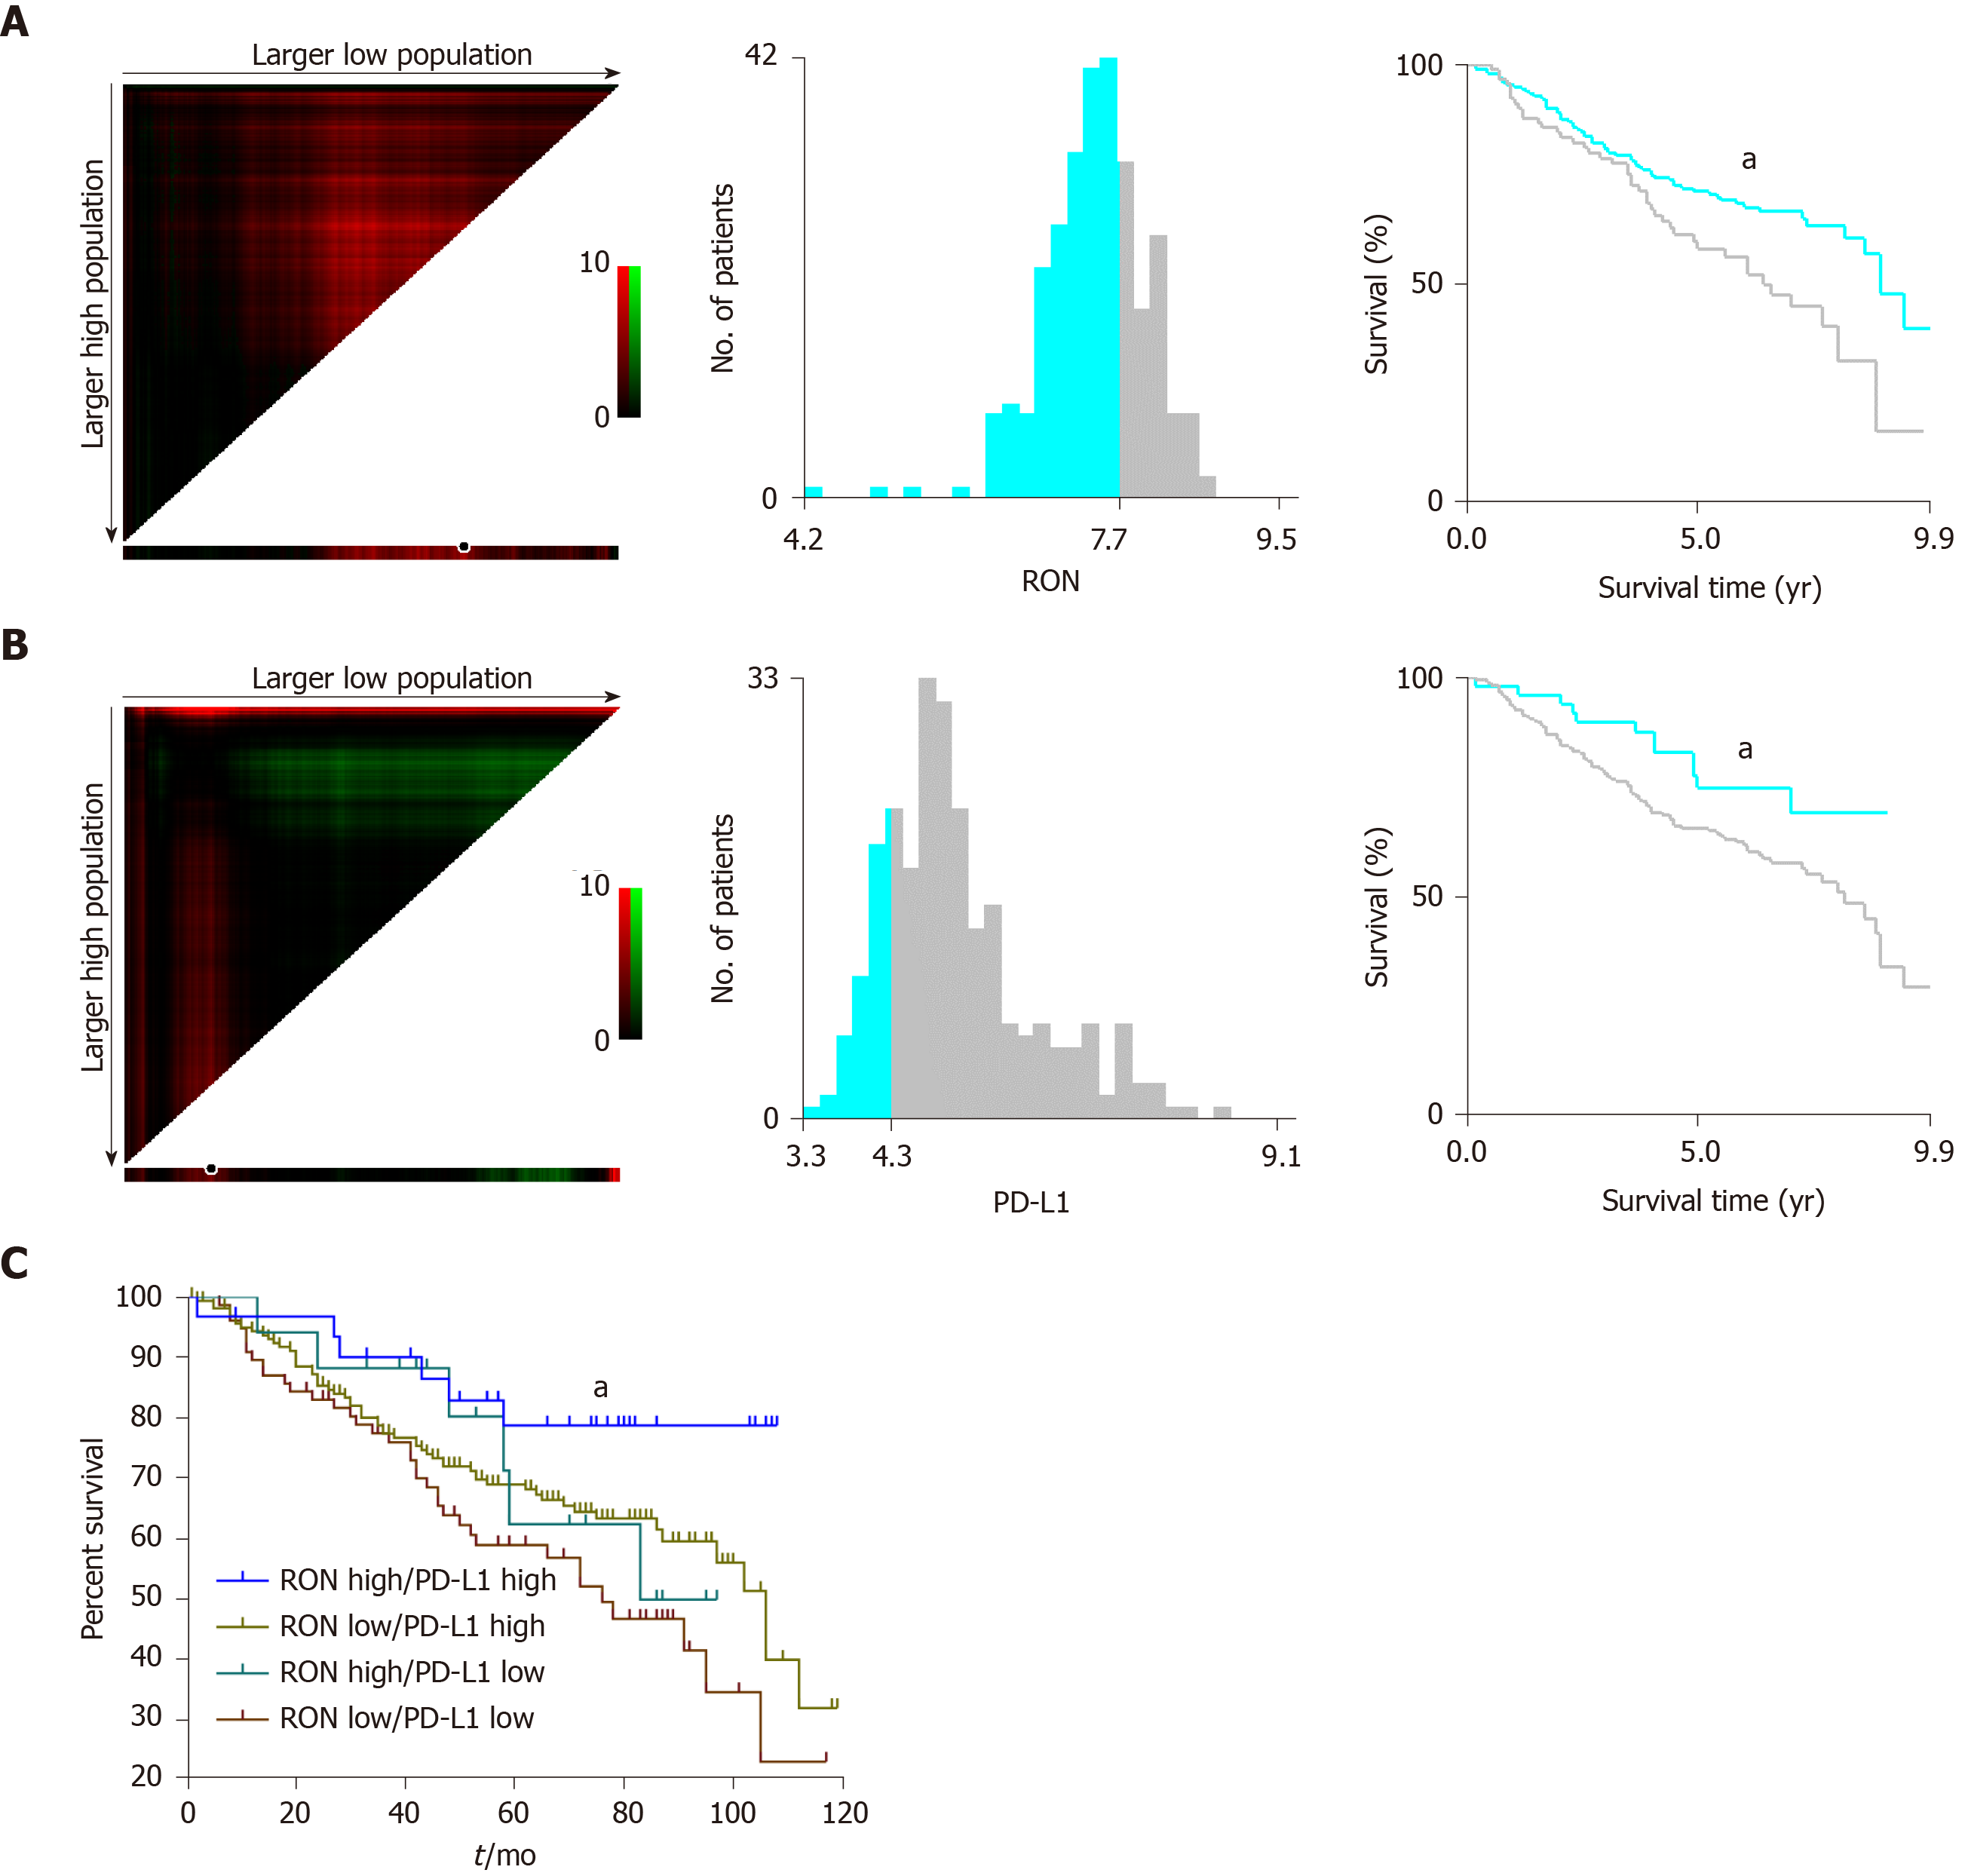
Figure 1 X-tile analysis to determine the optimal cut-off values for RON and PD-L1 expression and survival analysis in the GEO dataset.
The optimal cut-off values are highlighted by black circles (left panels) and shown in histograms for the entire cohort (middle panels). Kaplan-Meier survival plots are shown in right panels. A: The optimal cut-off value for RON was 7.50 (χ2 = 4.544, P = 0.033); B: The optimal cut-off value for PD-L1 was 4.30 (χ2 = 4.078, P = 0.043); C: Effect of different RON and PD-L1 expression states on patient survival. aP < 0.05.
- Citation: Liu YZ, Han DT, Shi DR, Hong B, Qian Y, Wu ZG, Yao SH, Tang TM, Wang MH, Xu XM, Yao HP. Pathological significance of abnormal recepteur d’origine nantais and programmed death ligand 1 expression in colorectal cancer. World J Gastrointest Oncol 2020; 12(11): 1216-1236
- URL: https://www.wjgnet.com/1948-5204/full/v12/i11/1216.htm
- DOI: https://dx.doi.org/10.4251/wjgo.v12.i11.1216


