Copyright
©The Author(s) 2020.
World J Gastrointest Oncol. Oct 15, 2020; 12(10): 1195-1208
Published online Oct 15, 2020. doi: 10.4251/wjgo.v12.i10.1195
Published online Oct 15, 2020. doi: 10.4251/wjgo.v12.i10.1195
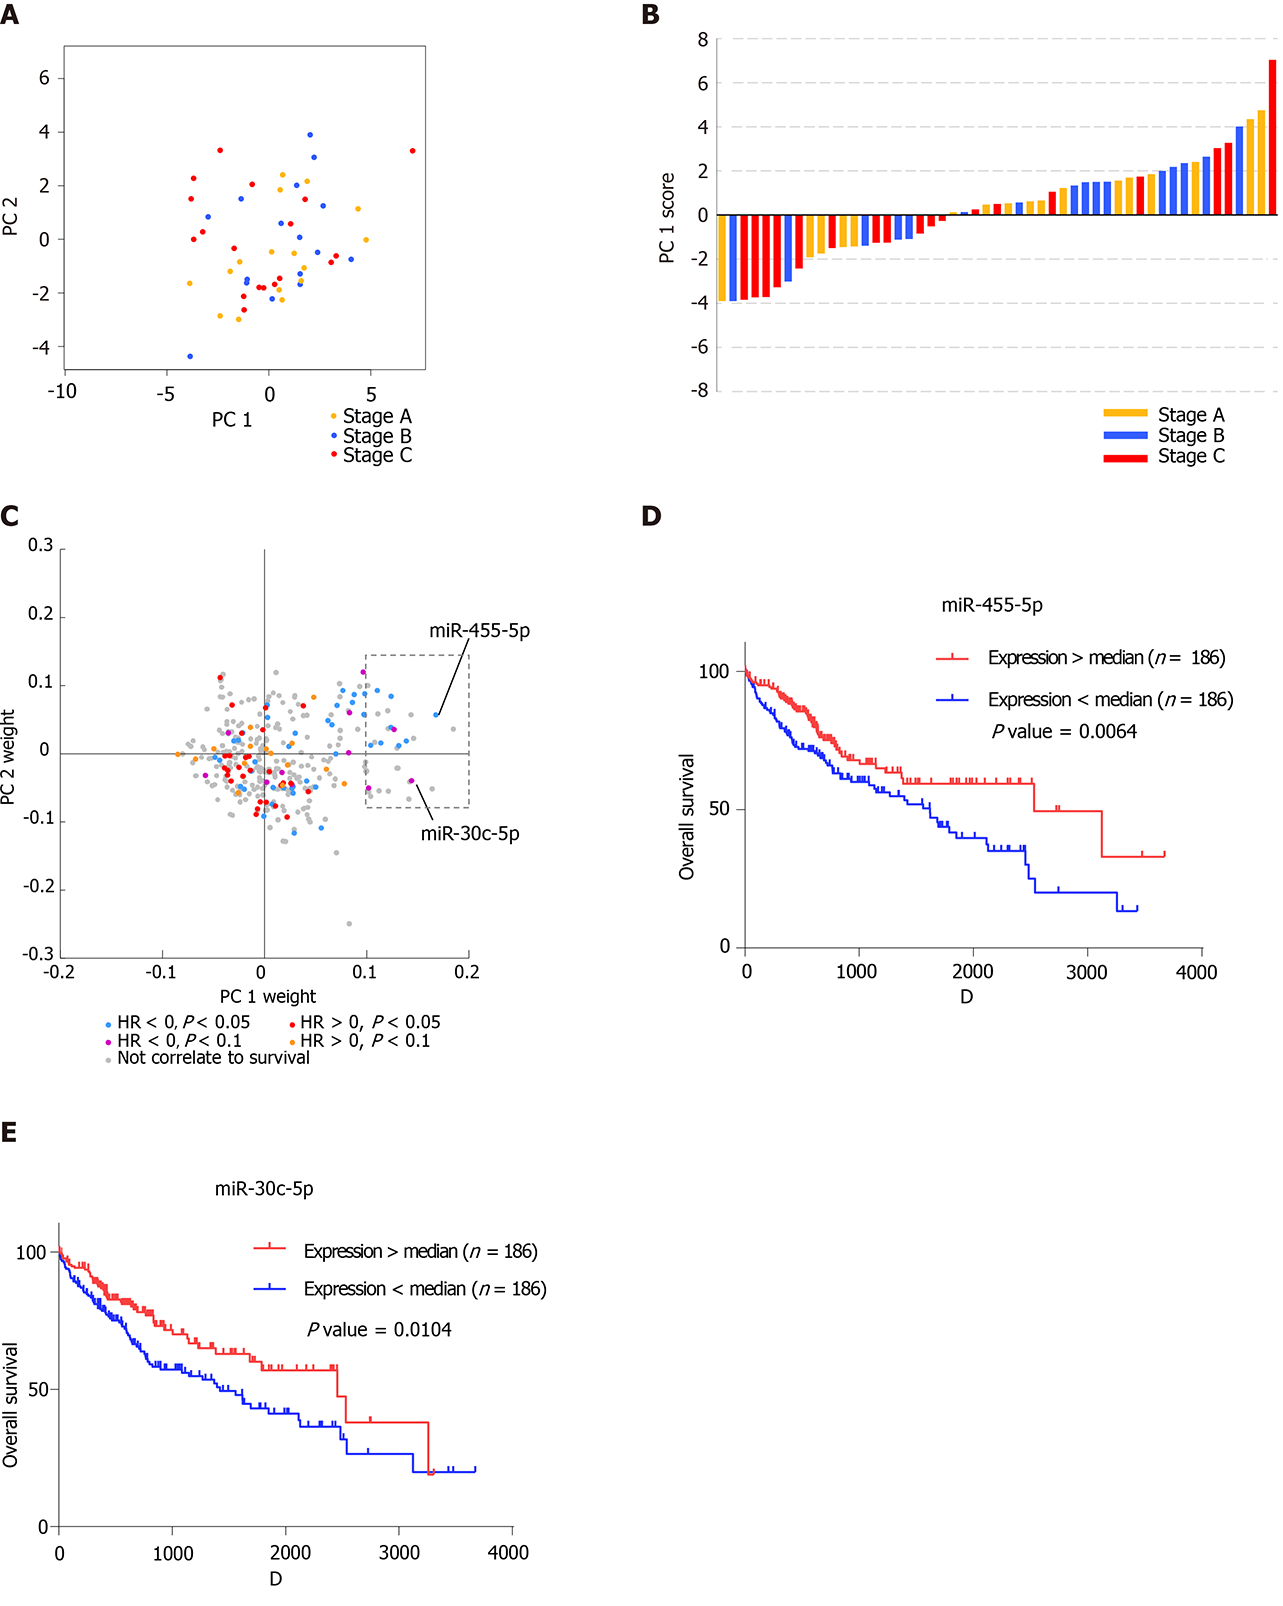
Figure 3 Blood exosomal micro ribonucleic acid profiles reveal the stage of tumor tissues.
A: Distribution of hepatocellular carcinoma patients with stage A, stage B, and stage C on principal components 1 (PC1) and PC2. The yellow represents the patients with stage A, the blue represents the patients with stage B, and the red represents the patients with stage C; B: Histogram displaying PC1 scores of patients with stage A, stage B, and stage C. The histogram color is labeled as in A; C: Distribution of PC1 weight and PC2 weight of each micro ribonucleic acid. The colorindicates the hazardous levels based on The Cancer Genome Atlas data; D: Kaplan–Meier analysis of overall survival of two groups (high expression and low expression of miR-455-5p); E: Kaplan–Meier analysis of overall survival of the two groups (high expression and low expression of miR-30c-5p).
- Citation: Sheng LQ, Li JR, Qin H, Liu L, Zhang DD, Zhang Q, Huang ML, Li XL, Xu XY, Wei YN, Chen ZS, Luo H, Zhang JY, Zhou CH, Chen H, Chen ZG, Li FG, Li NF. Blood exosomal micro ribonucleic acid profiling reveals the complexity of hepatocellular carcinoma and identifies potential biomarkers for differential diagnosis. World J Gastrointest Oncol 2020; 12(10): 1195-1208
- URL: https://www.wjgnet.com/1948-5204/full/v12/i10/1195.htm
- DOI: https://dx.doi.org/10.4251/wjgo.v12.i10.1195


