Copyright
©The Author(s) 2020.
World J Gastrointest Oncol. Jan 15, 2020; 12(1): 54-65
Published online Jan 15, 2020. doi: 10.4251/wjgo.v12.i1.54
Published online Jan 15, 2020. doi: 10.4251/wjgo.v12.i1.54
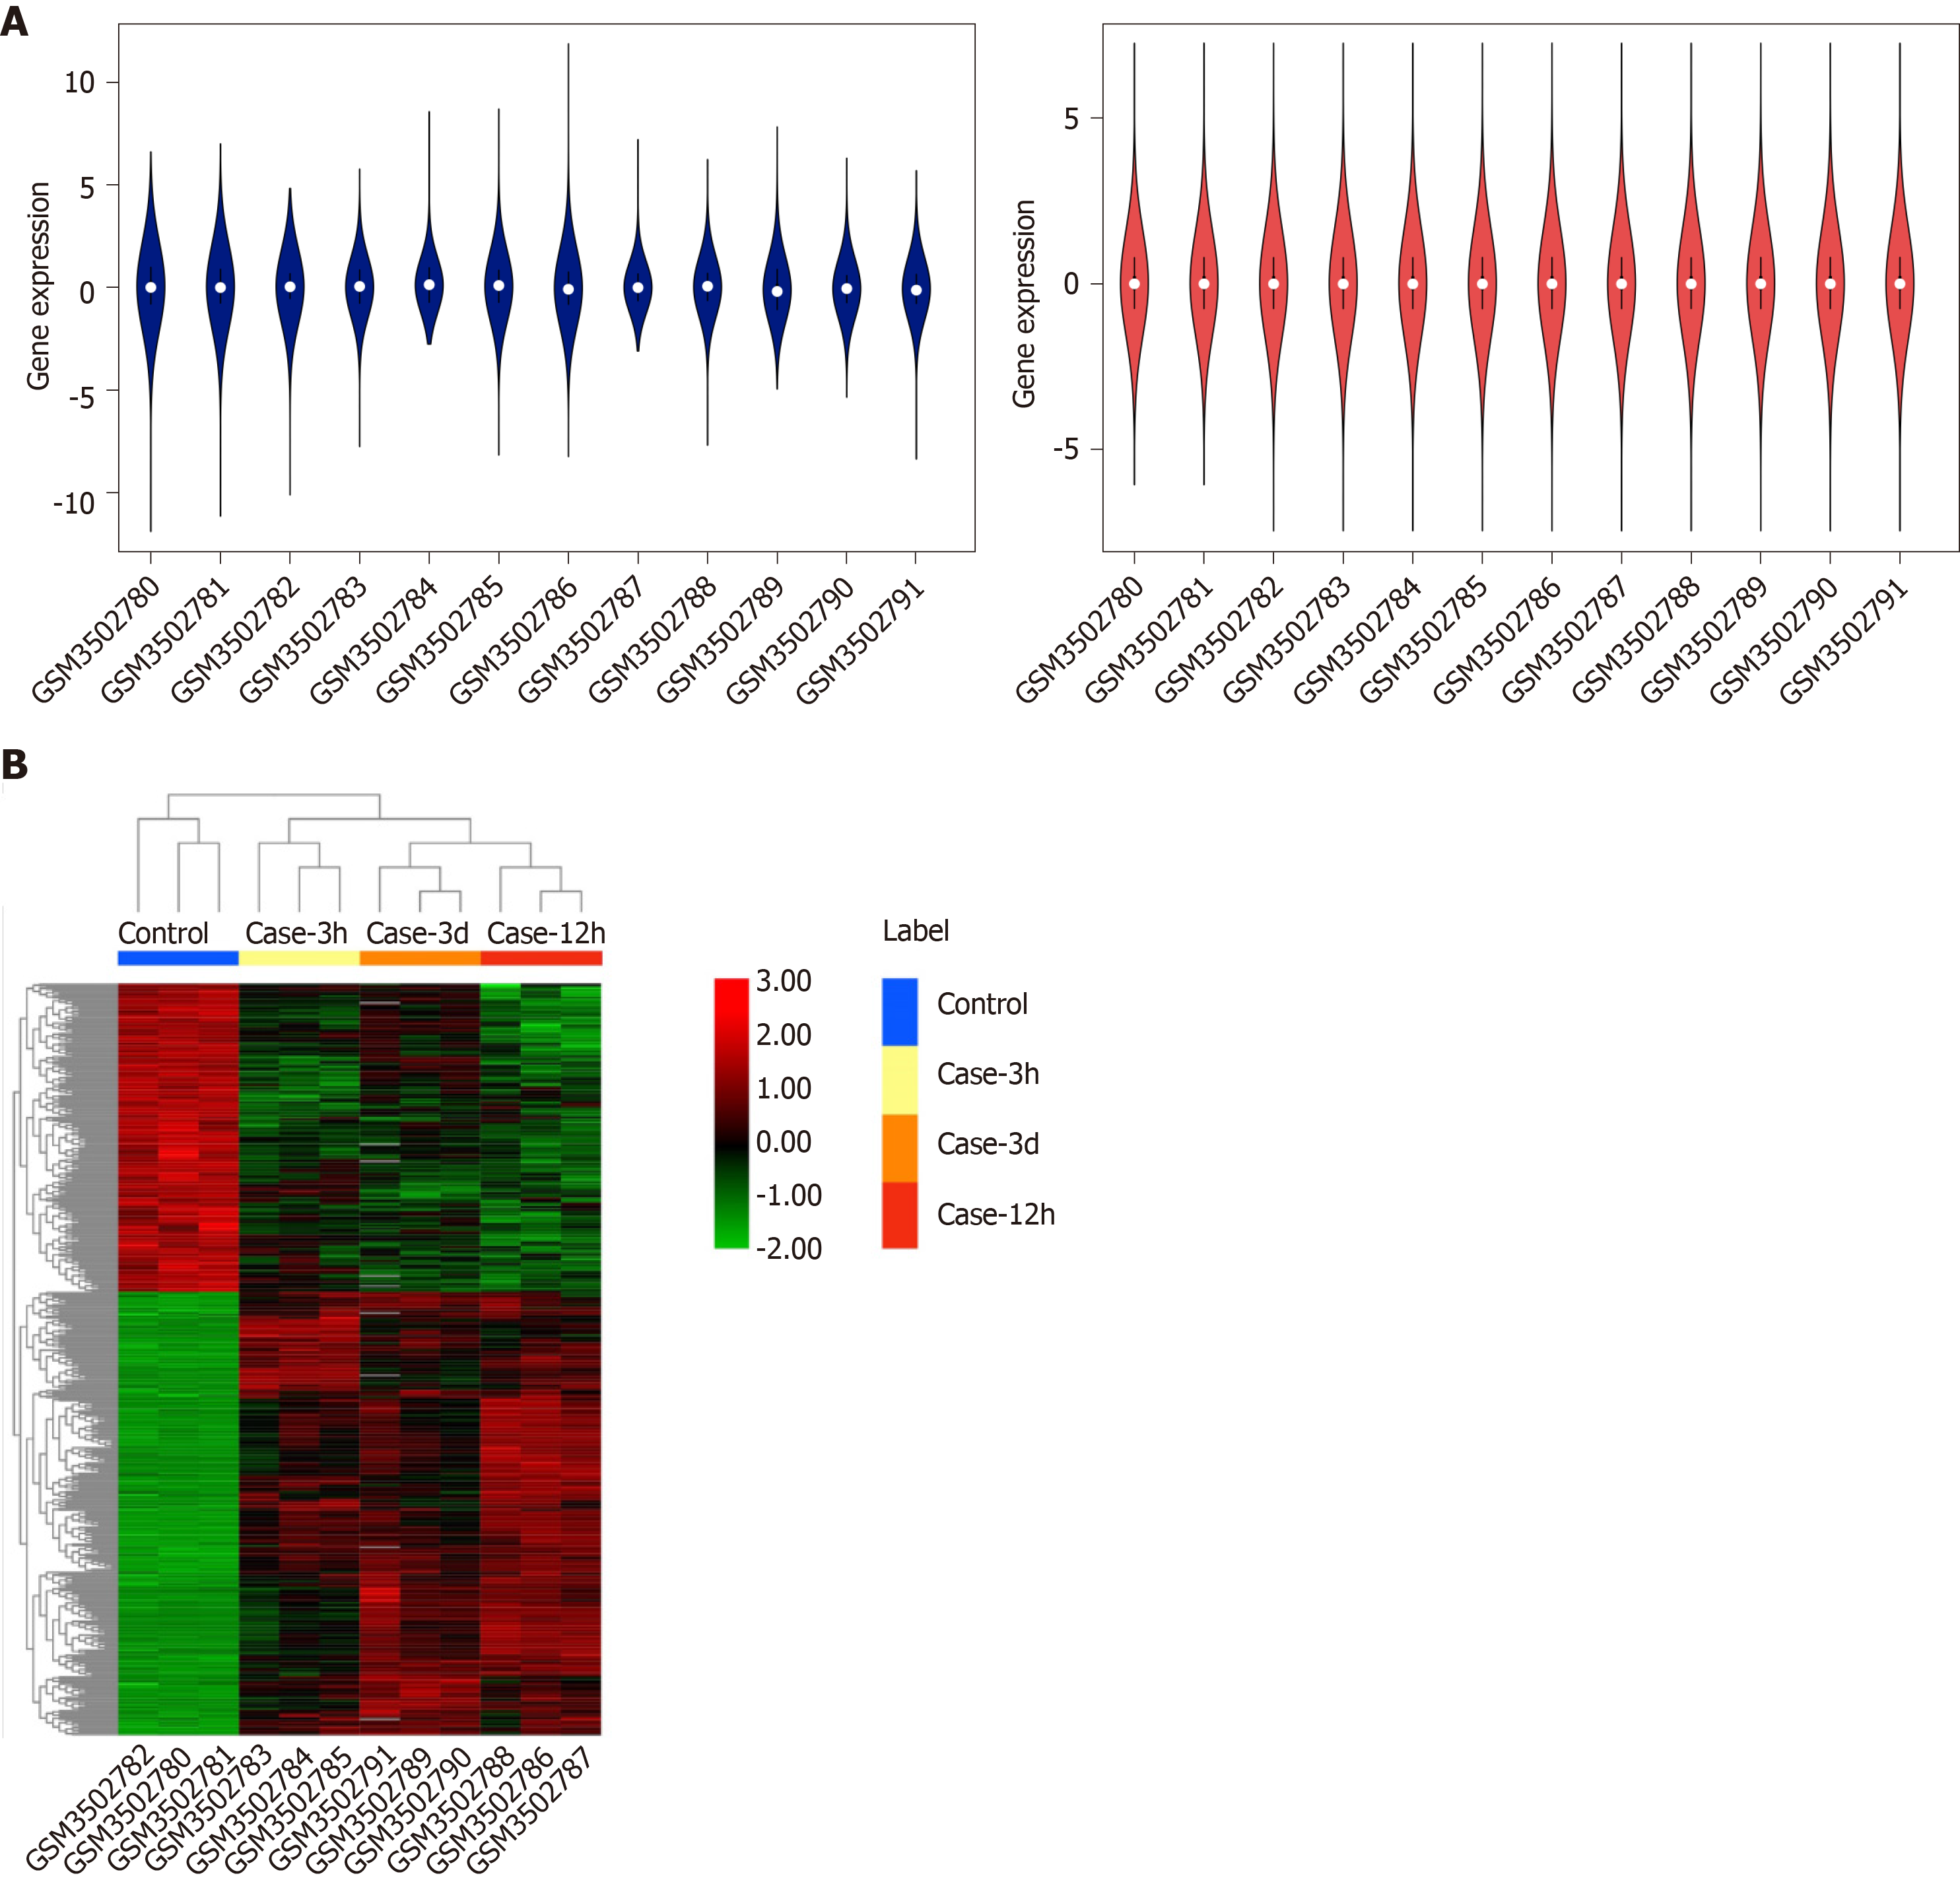
Figure 1 Box plots of data normalization and hierarchical cluster heatmap.
A: Box plots of data normalization. The blue box plot represents the data before normalization, whereas the red box plot represents the normalized data; B: Heatmap of the obtained DEGs.
- Citation: Bian YY, Yang LL, Yan Y, Zhao M, Chen YQ, Zhou YQ, Wang ZX, Li WL, Zeng L. Identification of candidate biomarkers correlated with pathogenesis of postoperative peritoneal adhesion by using microarray analysis. World J Gastrointest Oncol 2020; 12(1): 54-65
- URL: https://www.wjgnet.com/1948-5204/full/v12/i1/54.htm
- DOI: https://dx.doi.org/10.4251/wjgo.v12.i1.54


