Copyright
©The Author(s) 2019.
World J Gastrointest Oncol. Sep 15, 2019; 11(9): 717-728
Published online Sep 15, 2019. doi: 10.4251/wjgo.v11.i9.717
Published online Sep 15, 2019. doi: 10.4251/wjgo.v11.i9.717
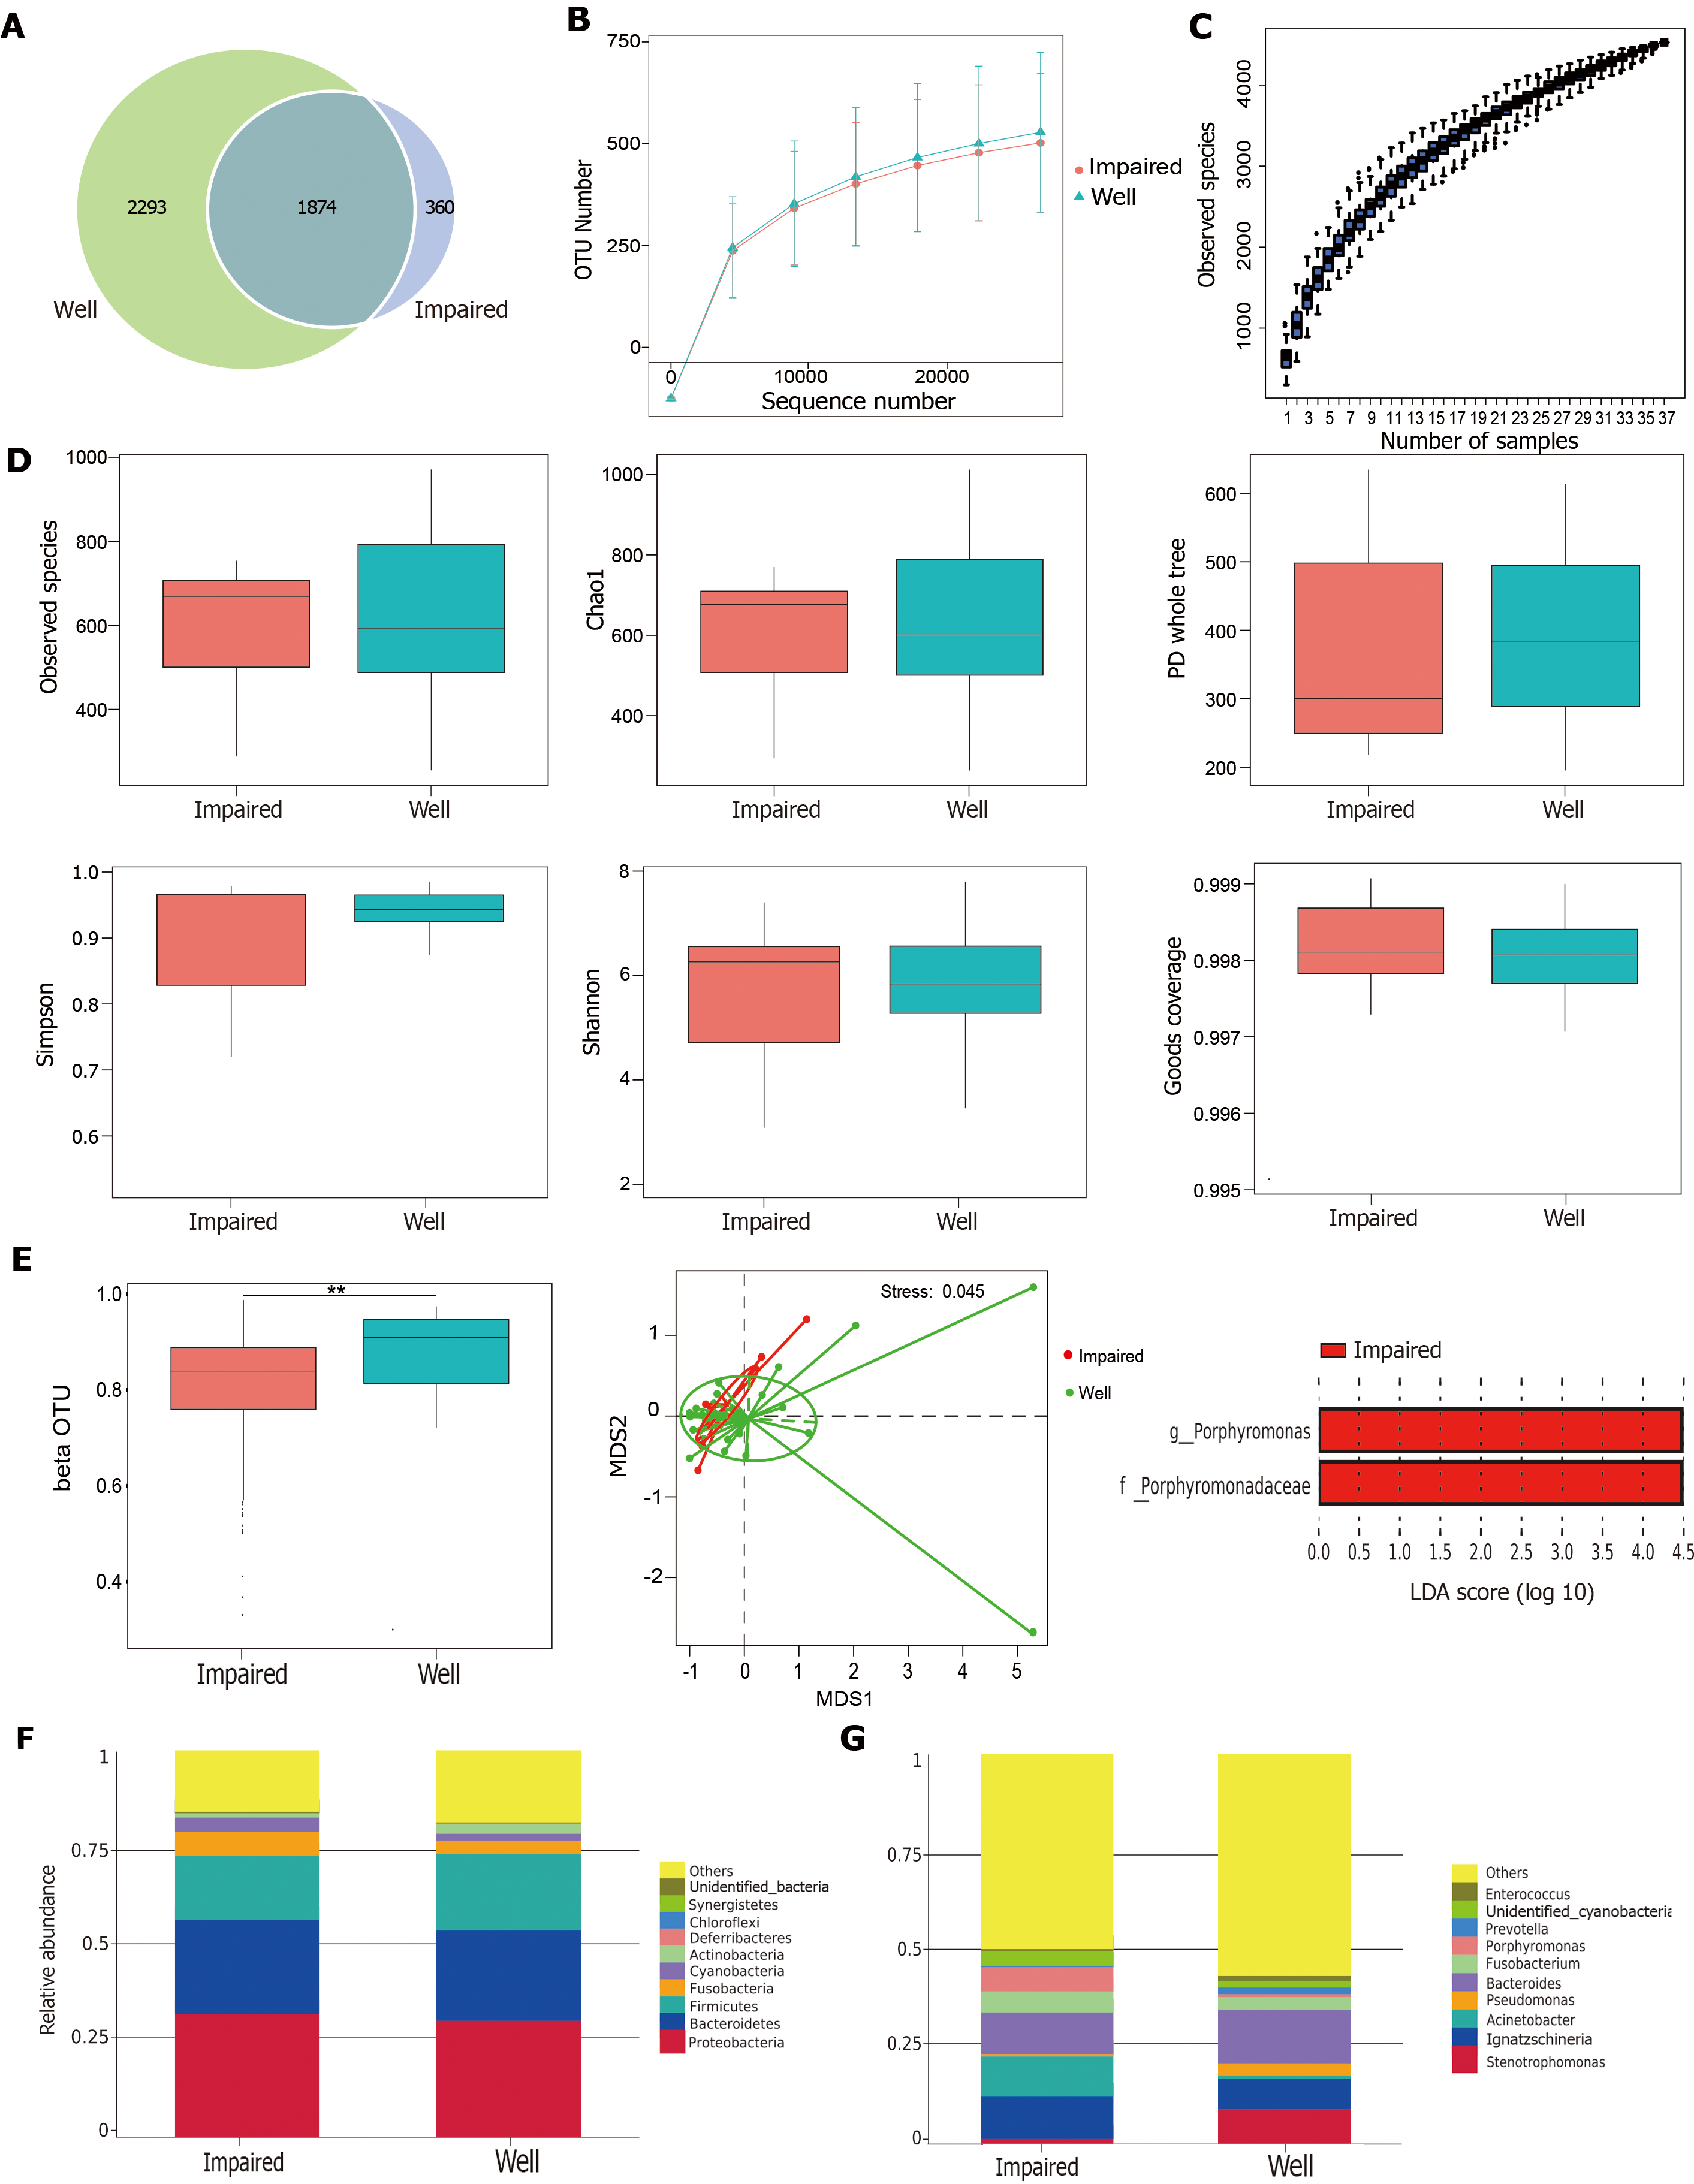
Figure 1 Structural change of the intestinal microbiota between impaired-healing group (n = 7) and well-healing group (n = 30).
A: Venn diagram illustrating the total, unique, and shared numbers of OTUs predicted for impaired-healing group and well-healing group datasets; B: Rarefaction curve of OUT; C: Species accumulation boxplot; D: Alpha diversity analysis using observed species index, Shannon index, Simpson index, Chao1 index, Goods coverage index, and PD whole tree index; E: Beta diversity was significantly different between two groups by Wilcoxon test, bP < 0.01; non-metric multi-dimensional scaling scores plot of weighted UniFrac distance matrix based on the relative abundance of OTU. Each symbol represents a sample. Colors represent different groups, stress = 0.045 < 0.2; LDA effect size (LEfSe) showed significant differences in Porphyromonas genus and Porphyromonadaceae family between two groups; F: Top-ten dominant phyla of two groups; G: Top-ten dominant genera of two groups.
- Citation: Li YD, He KX, Zhu WF. Correlation between invasive microbiota in margin-surrounding mucosa and anastomotic healing in patients with colorectal cancer. World J Gastrointest Oncol 2019; 11(9): 717-728
- URL: https://www.wjgnet.com/1948-5204/full/v11/i9/717.htm
- DOI: https://dx.doi.org/10.4251/wjgo.v11.i9.717


