Copyright
©The Author(s) 2019.
World J Gastrointest Oncol. Apr 15, 2019; 11(4): 281-294
Published online Apr 15, 2019. doi: 10.4251/wjgo.v11.i4.281
Published online Apr 15, 2019. doi: 10.4251/wjgo.v11.i4.281
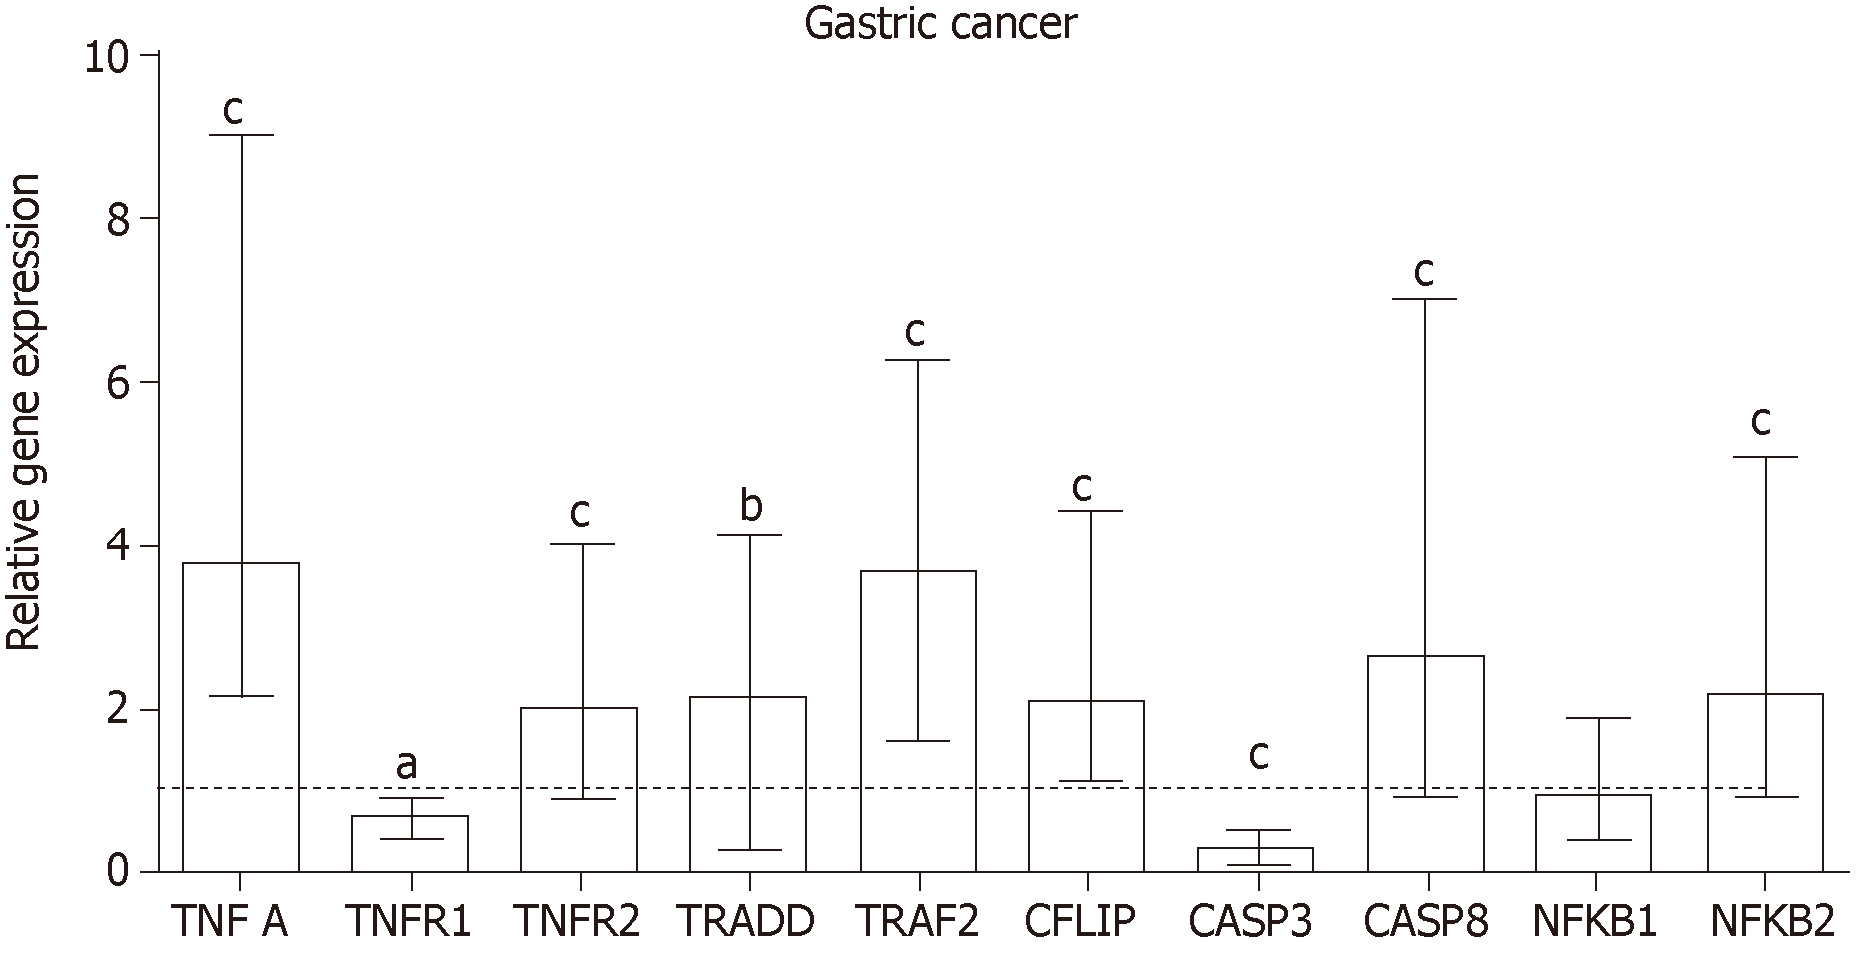
Figure 1 Relative expression of tumor necrosis factor-α pathway genes in gastric cancer.
Data are presented as the relative quantification (RQ) median with interquartile range. The line represents the RQ median of normal mucosa. Statistically significant difference, according to the Wilcoxon signed rank test: aP ≤ 0.05; bP ≤ 0.01; cP ≤ 0.001 in relation to normal mucosa and reference genes (ACTB and GAPDH).
- Citation: Rossi AFT, Contiero JC, Manoel-Caetano FDS, Severino FE, Silva AE. Up-regulation of tumor necrosis factor-α pathway survival genes and of the receptor TNFR2 in gastric cancer. World J Gastrointest Oncol 2019; 11(4): 281-294
- URL: https://www.wjgnet.com/1948-5204/full/v11/i4/281.htm
- DOI: https://dx.doi.org/10.4251/wjgo.v11.i4.281


