Copyright
©The Author(s) 2019.
World J Gastrointest Oncol. Nov 15, 2019; 11(11): 998-1010
Published online Nov 15, 2019. doi: 10.4251/wjgo.v11.i11.998
Published online Nov 15, 2019. doi: 10.4251/wjgo.v11.i11.998
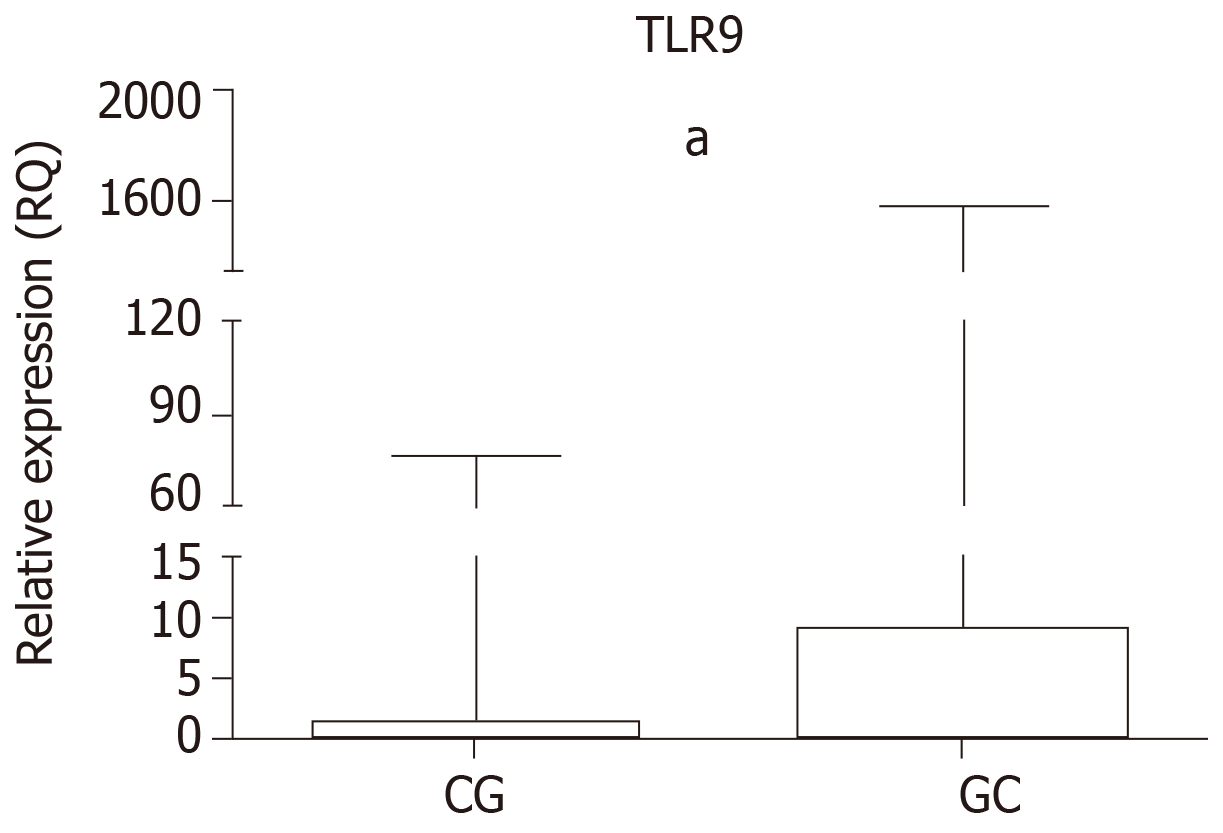
Figure 1 Relative gene expression levels of TLR9.
Comparison between CG and GC groups with the normal mucosa (Median = 1), and between the CG and GC groups (aP < 0.0001). Data are presented as the RQ median with interquartile range. Significant difference (P < 0.05). GC: Gastric cancer; CG: Chronic gastritis; RQ: Relative quantification.
- Citation: Susi MD, Lourenço Caroline M, Rasmussen LT, Payão SLM, Rossi AFT, Silva AE, Oliveira-Cucolo JG. Toll-like receptor 9 polymorphisms and Helicobacter pylori influence gene expression and risk of gastric carcinogenesis in the Brazilian population.. World J Gastrointest Oncol 2019; 11(11): 998-1010
- URL: https://www.wjgnet.com/1948-5204/full/v11/i11/998.htm
- DOI: https://dx.doi.org/10.4251/wjgo.v11.i11.998


