Copyright
©The Author(s) 2019.
World J Gastrointest Oncol. Nov 15, 2019; 11(11): 983-997
Published online Nov 15, 2019. doi: 10.4251/wjgo.v11.i11.983
Published online Nov 15, 2019. doi: 10.4251/wjgo.v11.i11.983
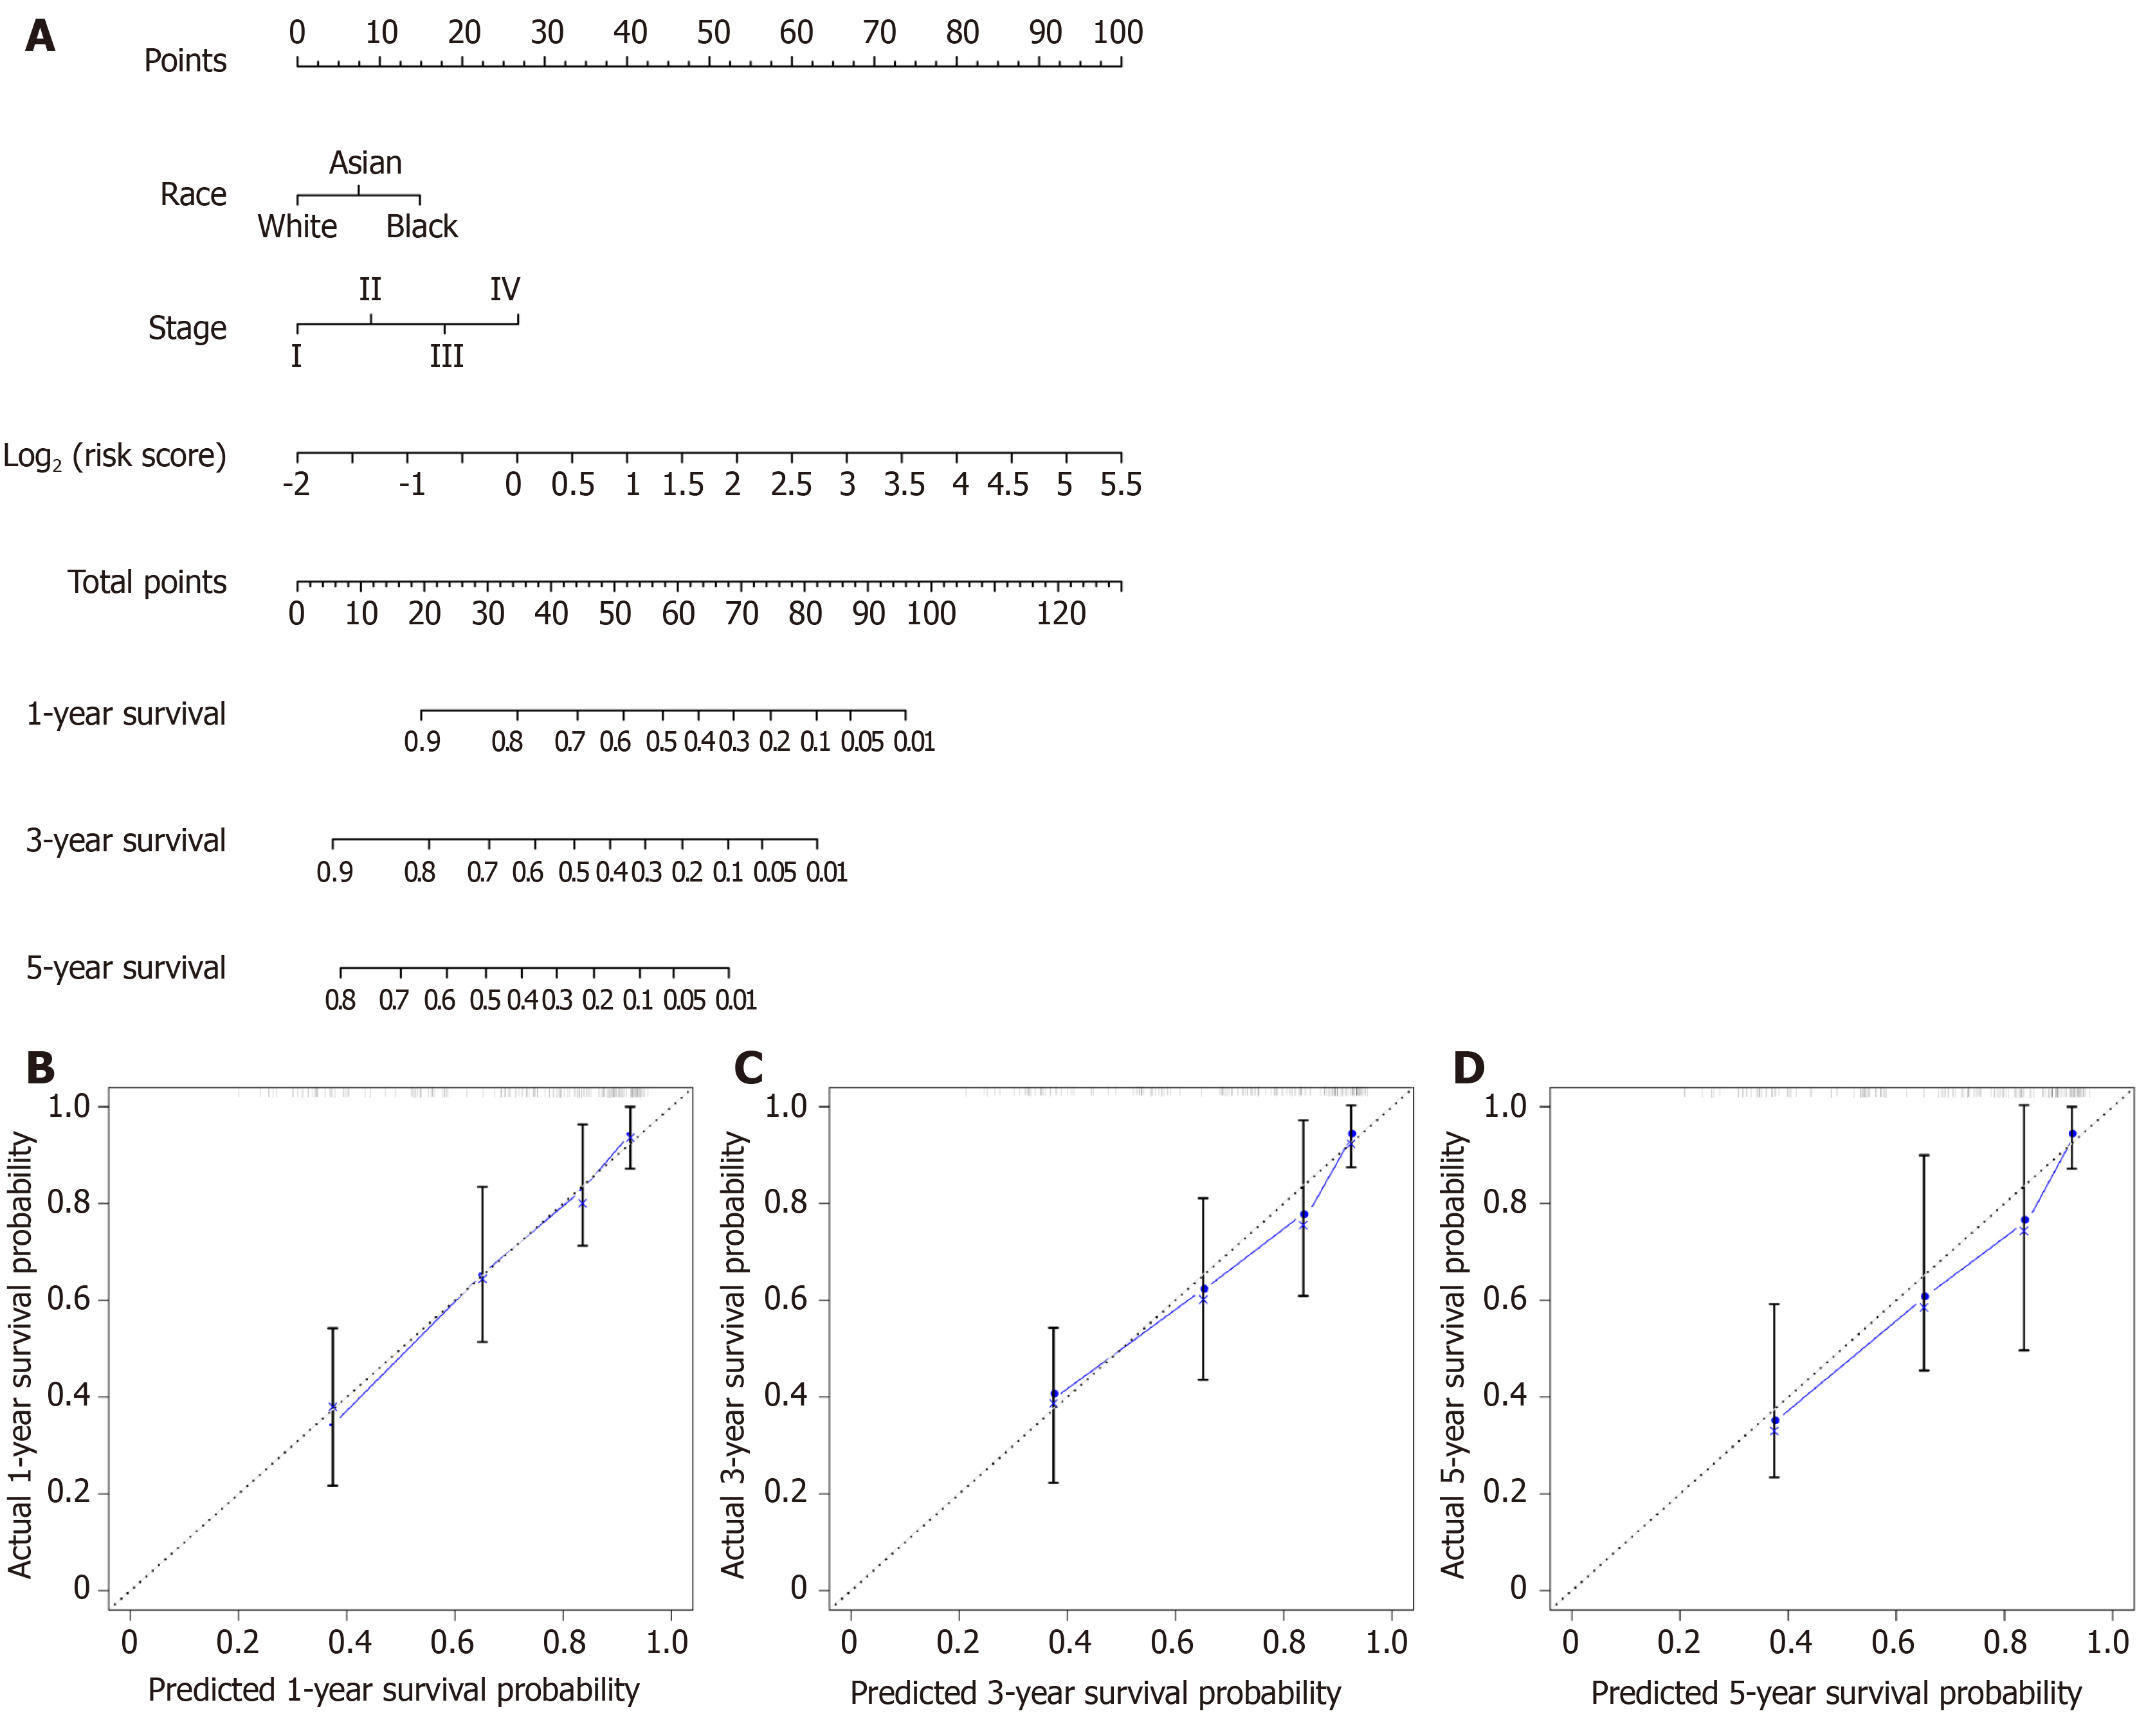
Figure 6 Overall survival nomogram predicting 1-, 3-, and 5-year survival of hepatocellular carcinoma, and calibrated curves to predict the 1-year, 3-years, and 5-year patient survival.
A: Overall survival nomogram predicting 1-, 3-, and 5-year survival of hepatocellular carcinoma; B: Calibrated curve to predict the 1-year patient survival; C: Calibrated curve to predict the 3-years patient survival; D: Calibrated curve to predict the 5-years patient survival. In calibrated curves, the X-axis represents the survival prediction by nomogram, and the Y-axis represents the actual observation which showed a good agreement with prediction.
- Citation: Huang ZL, Li W, Chen QF, Wu PH, Shen LJ. Eight key long non-coding RNAs predict hepatitis virus positive hepatocellular carcinoma as prognostic targets. World J Gastrointest Oncol 2019; 11(11): 983-997
- URL: https://www.wjgnet.com/1948-5204/full/v11/i11/983.htm
- DOI: https://dx.doi.org/10.4251/wjgo.v11.i11.983


