Copyright
©The Author(s) 2019.
World J Gastrointest Oncol. Nov 15, 2019; 11(11): 983-997
Published online Nov 15, 2019. doi: 10.4251/wjgo.v11.i11.983
Published online Nov 15, 2019. doi: 10.4251/wjgo.v11.i11.983
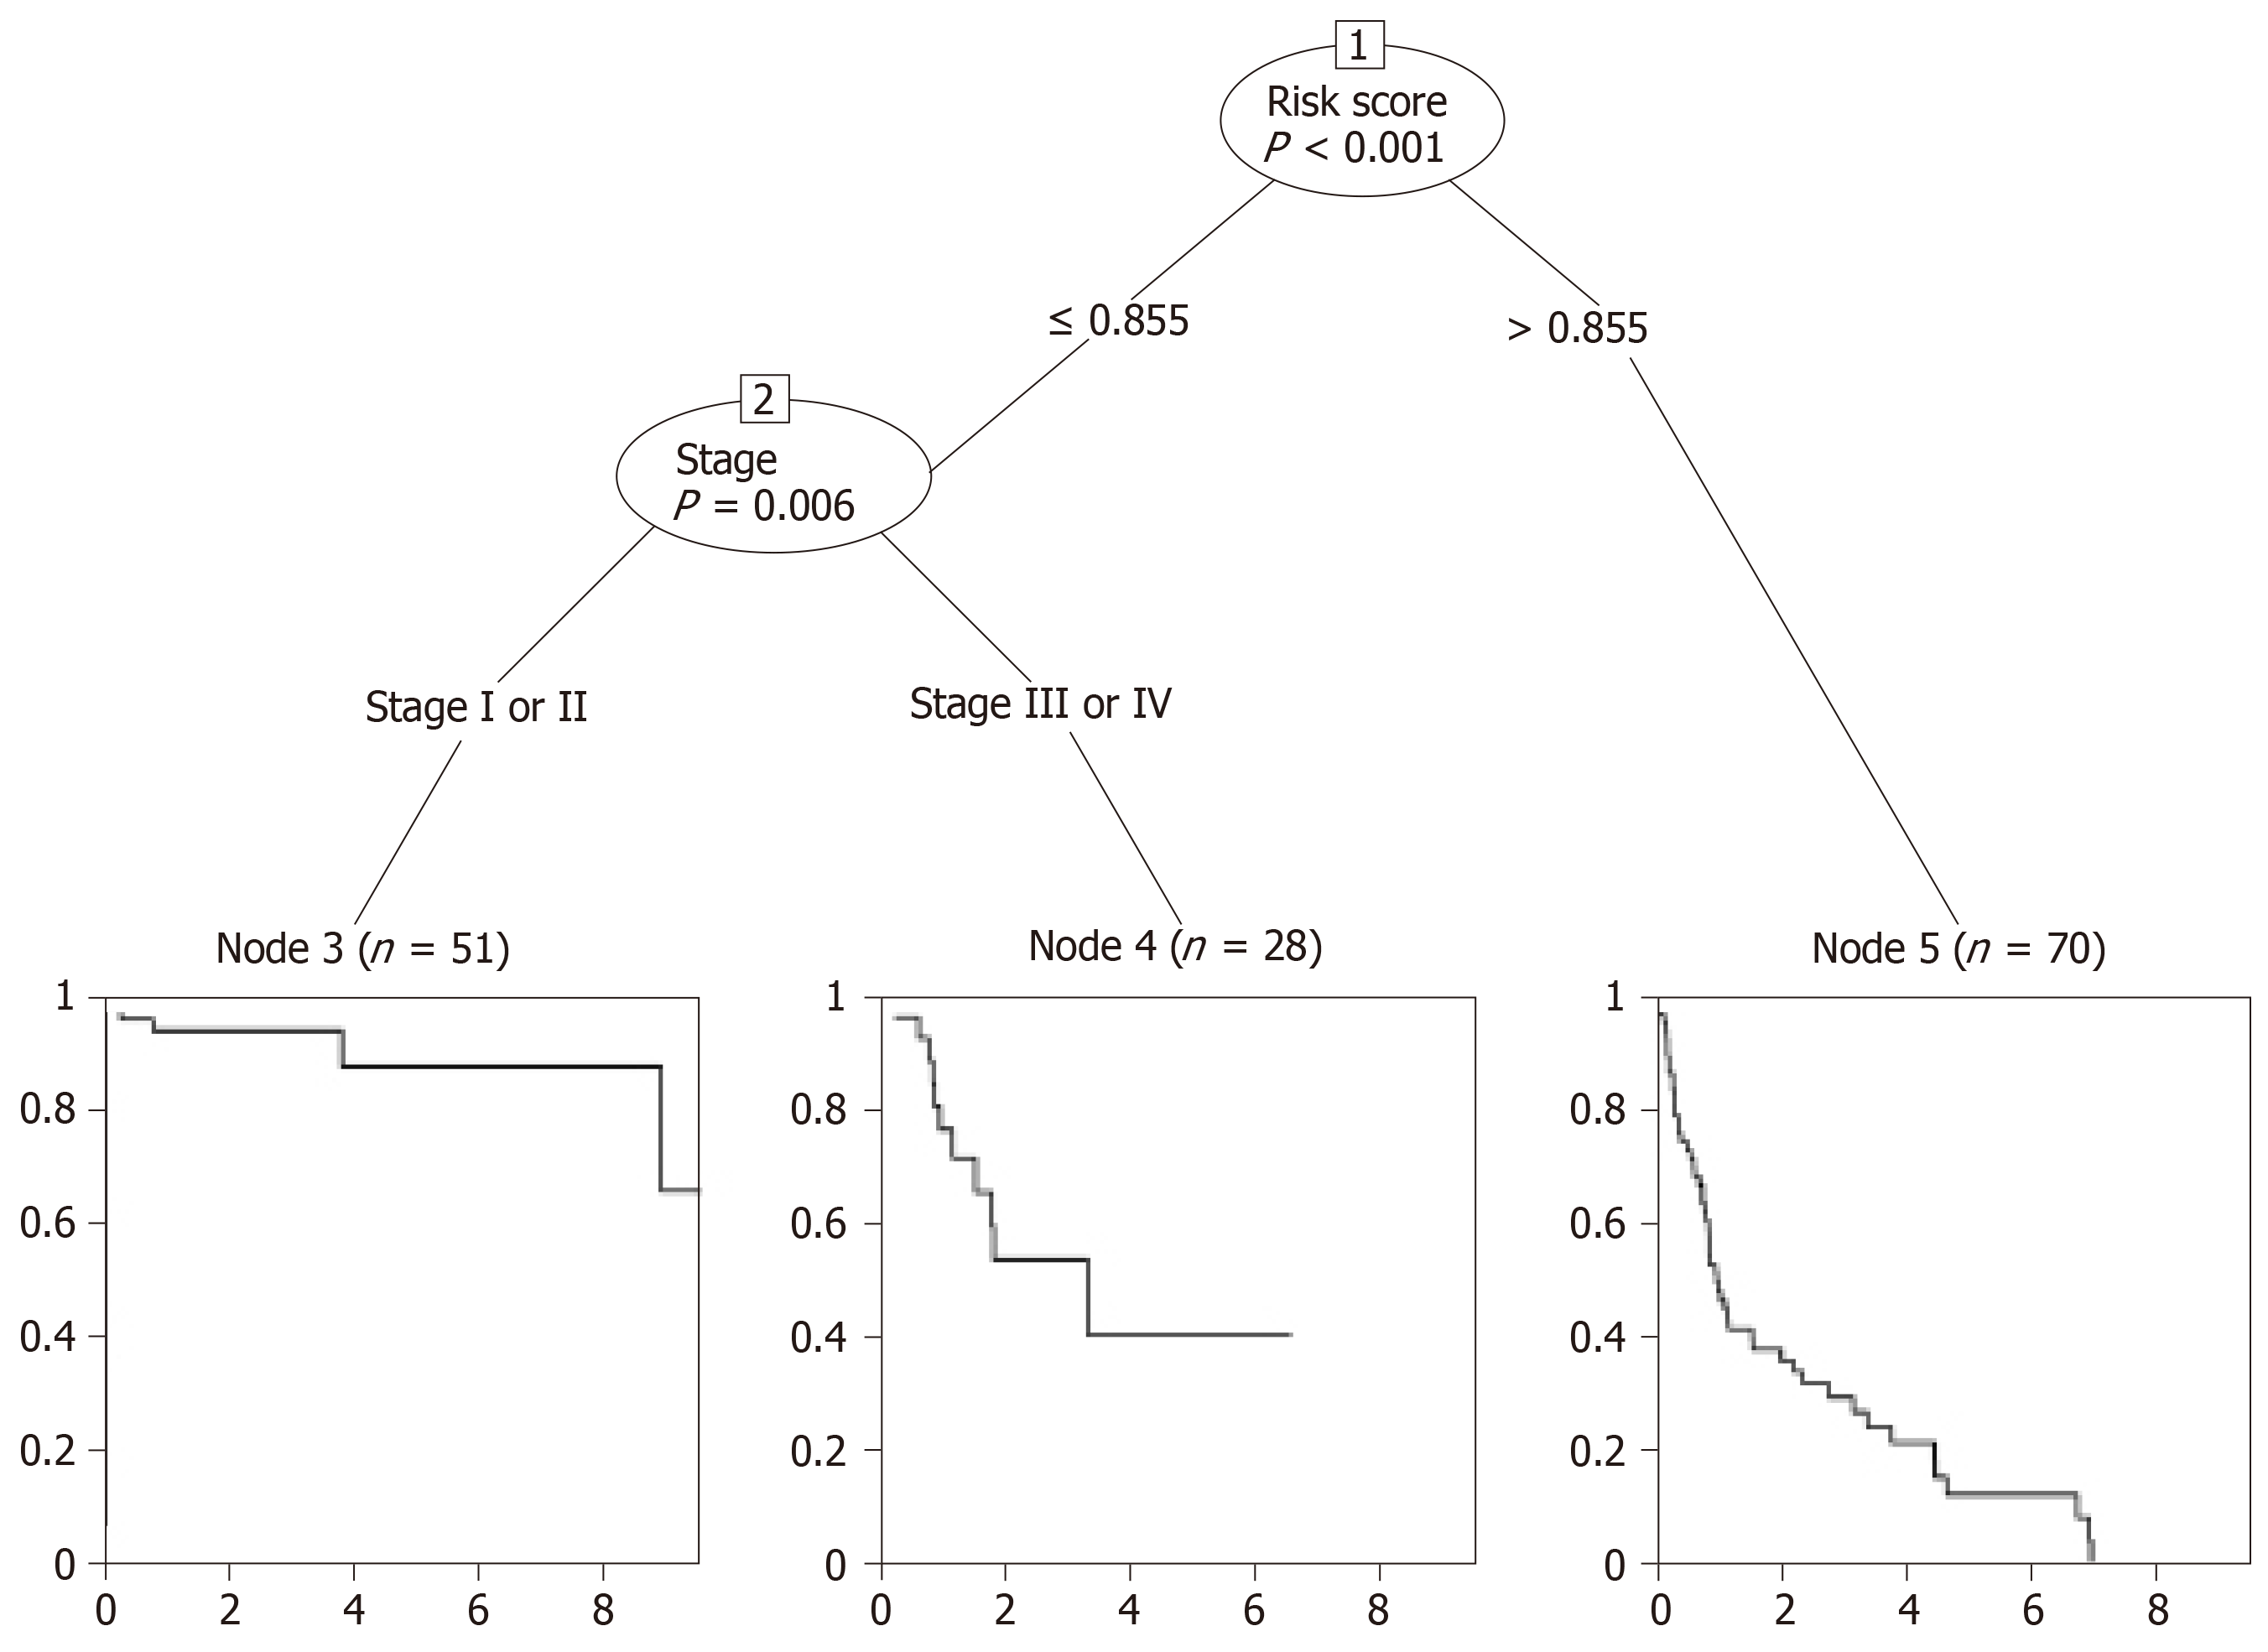
Figure 5 Conditional interference tree for prediction.
The nodes of the conditional inference tree were calculated automatically based on the influence power of variables. The first node of the tree was risk_score, while the second was stage. Node 3, 4, or 5 was the corresponding group a certain patient would be assigned to. For example, a stage I patient with a risk_score ≤ 0.855 would be divided into group node 3, which was related to the best overall survival.
- Citation: Huang ZL, Li W, Chen QF, Wu PH, Shen LJ. Eight key long non-coding RNAs predict hepatitis virus positive hepatocellular carcinoma as prognostic targets. World J Gastrointest Oncol 2019; 11(11): 983-997
- URL: https://www.wjgnet.com/1948-5204/full/v11/i11/983.htm
- DOI: https://dx.doi.org/10.4251/wjgo.v11.i11.983


