Copyright
©The Author(s) 2019.
World J Gastrointest Oncol. Nov 15, 2019; 11(11): 983-997
Published online Nov 15, 2019. doi: 10.4251/wjgo.v11.i11.983
Published online Nov 15, 2019. doi: 10.4251/wjgo.v11.i11.983
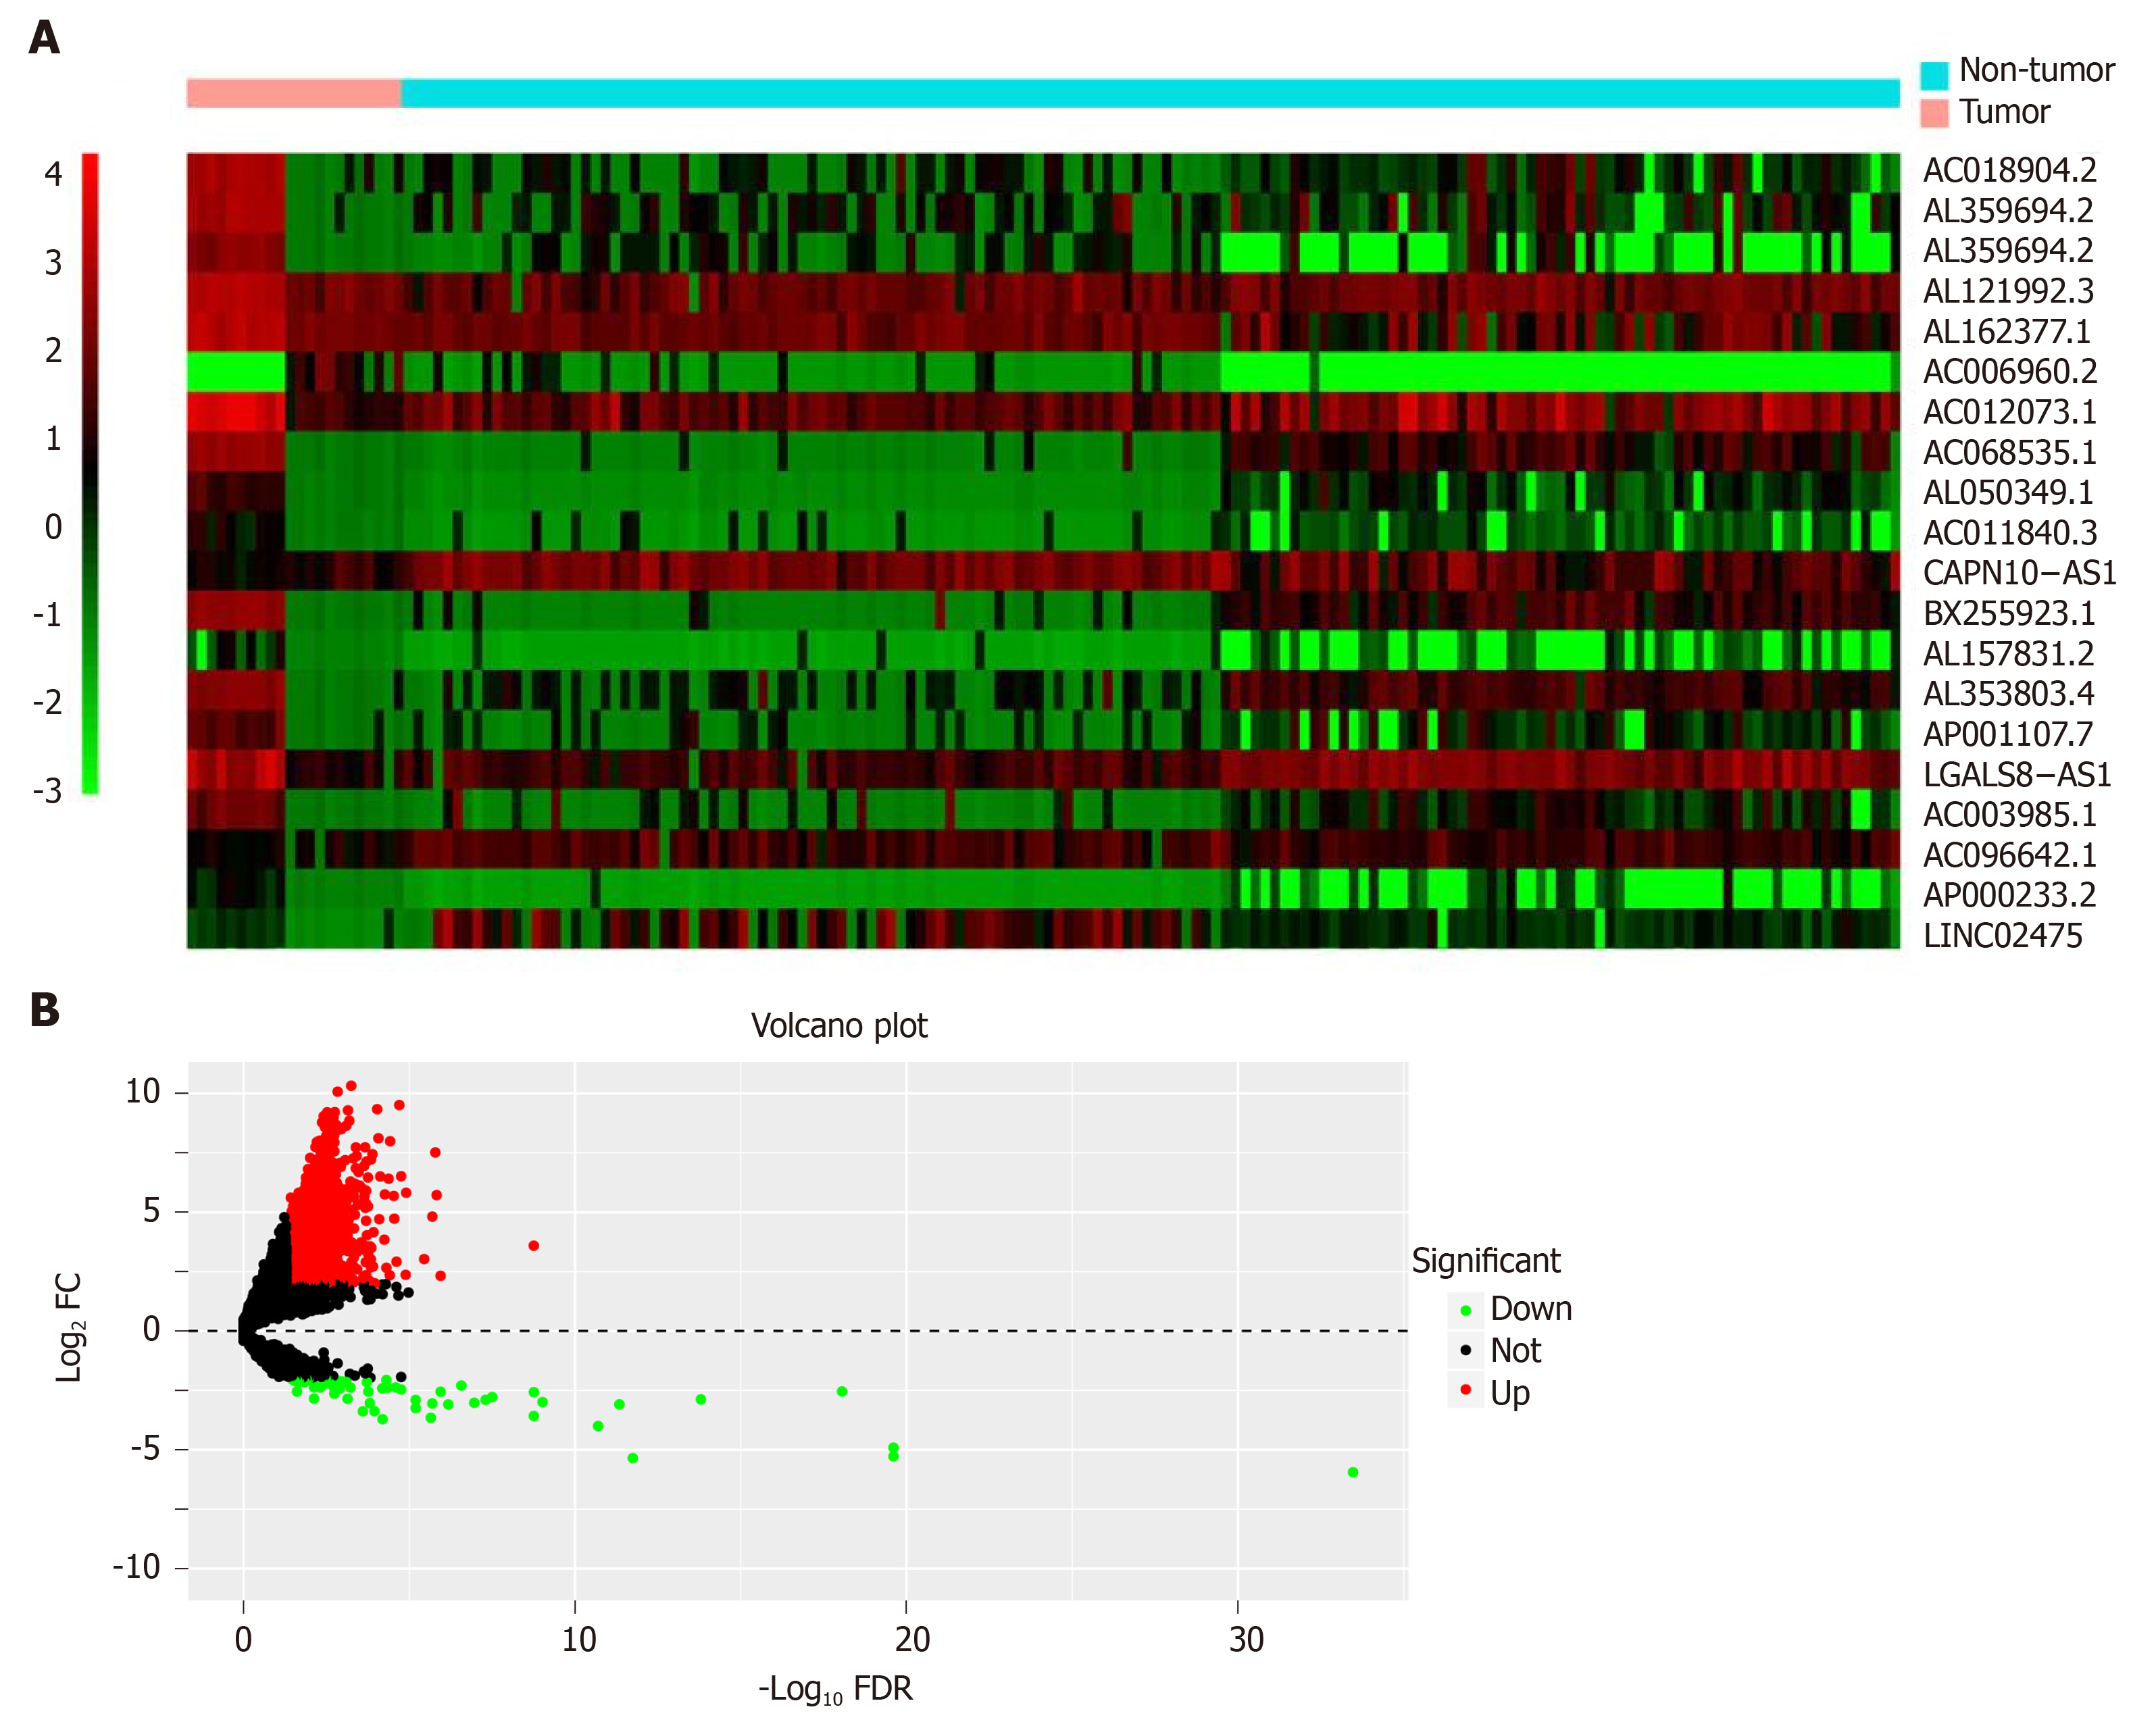
Figure 2 Heat map and volcano plot.
A: Heat map demonstrating the differential expression of long non-coding RNAs (lncRNAs). The X-axis represents the samples, while the Y-axis denotes the differentially expressed lncRNAs. Green color is indicative of the down-regulated genes, while the red color stands for the up-regulated genes; B: Volcano plot showing the differential expression of lncRNAs. The X-axis indicates the false discovery rate values after log transformation, whereas the Y-axis suggests the log2 (fold change) values for lncRNA expression. FDR: False discovery rate; FC: Fold change.
- Citation: Huang ZL, Li W, Chen QF, Wu PH, Shen LJ. Eight key long non-coding RNAs predict hepatitis virus positive hepatocellular carcinoma as prognostic targets. World J Gastrointest Oncol 2019; 11(11): 983-997
- URL: https://www.wjgnet.com/1948-5204/full/v11/i11/983.htm
- DOI: https://dx.doi.org/10.4251/wjgo.v11.i11.983


