Copyright
©The Author(s) 2018.
World J Gastrointest Oncol. Feb 15, 2018; 10(2): 62-70
Published online Feb 15, 2018. doi: 10.4251/wjgo.v10.i2.62
Published online Feb 15, 2018. doi: 10.4251/wjgo.v10.i2.62
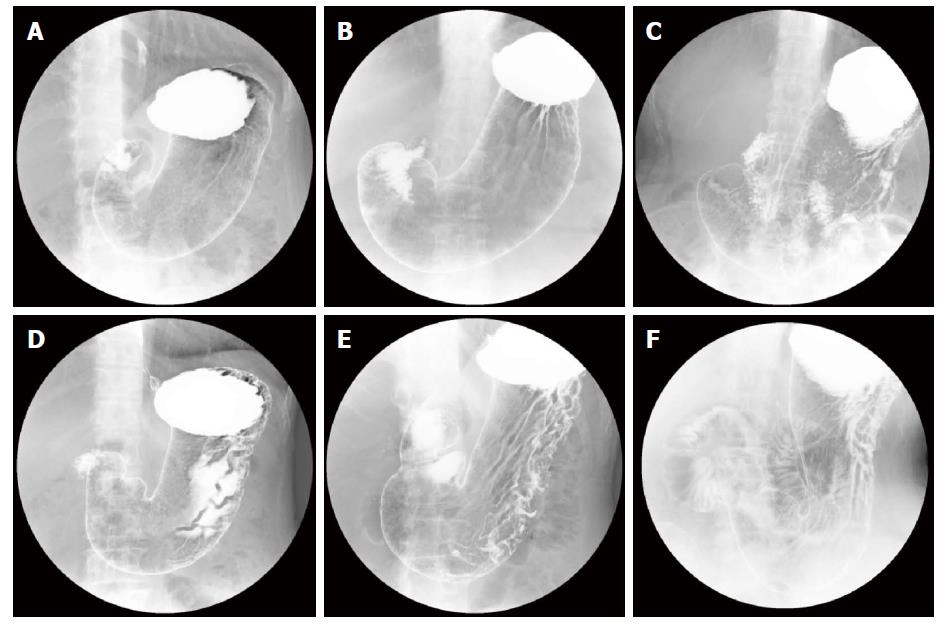
Figure 4 Examples of X-ray images correctly or incorrectly classified in the second stage.
A: True class: Group C (D). Predicted class: Severe (Correct classification); B: True class: Group C (D). Predicted class: Severe (Correct classification); C: True class: Group C (D). Predicted class: Non-severe (Incorrect classification); D: True class: Group B. Predicted class: Non-severe (Correct classification); E: True class: Group B. Predicted class: Non-severe (Correct classification); F: True class: Group B. Predicted class: Severe (Incorrect classification).
- Citation: Togo R, Ishihara K, Mabe K, Oizumi H, Ogawa T, Kato M, Sakamoto N, Nakajima S, Asaka M, Haseyama M. Preliminary study of automatic gastric cancer risk classification from photofluorography. World J Gastrointest Oncol 2018; 10(2): 62-70
- URL: https://www.wjgnet.com/1948-5204/full/v10/i2/62.htm
- DOI: https://dx.doi.org/10.4251/wjgo.v10.i2.62


