Copyright
©The Author(s) 2018.
World J Gastrointest Oncol. Dec 15, 2018; 10(12): 496-504
Published online Dec 15, 2018. doi: 10.4251/wjgo.v10.i12.496
Published online Dec 15, 2018. doi: 10.4251/wjgo.v10.i12.496
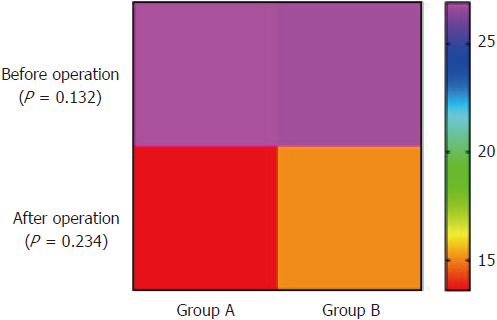
Figure 4 Heat map of comparison of portosystemic pressure gradient measurements before and after operation between Groups A and B.
Student’s t test was used to compare portosystemic pressure gradient at each time point, and no difference was found between the two groups.
- Citation: Wu YF, Wang T, Yue ZD, Zhao HW, Wang L, Fan ZH, He FL, Liu FQ. Stents combined with iodine-125 implantation to treat main portal vein tumor thrombus. World J Gastrointest Oncol 2018; 10(12): 496-504
- URL: https://www.wjgnet.com/1948-5204/full/v10/i12/496.htm
- DOI: https://dx.doi.org/10.4251/wjgo.v10.i12.496


