Copyright
©The Author(s) 2018.
World J Gastrointest Oncol. Nov 15, 2018; 10(11): 439-448
Published online Nov 15, 2018. doi: 10.4251/wjgo.v10.i11.439
Published online Nov 15, 2018. doi: 10.4251/wjgo.v10.i11.439
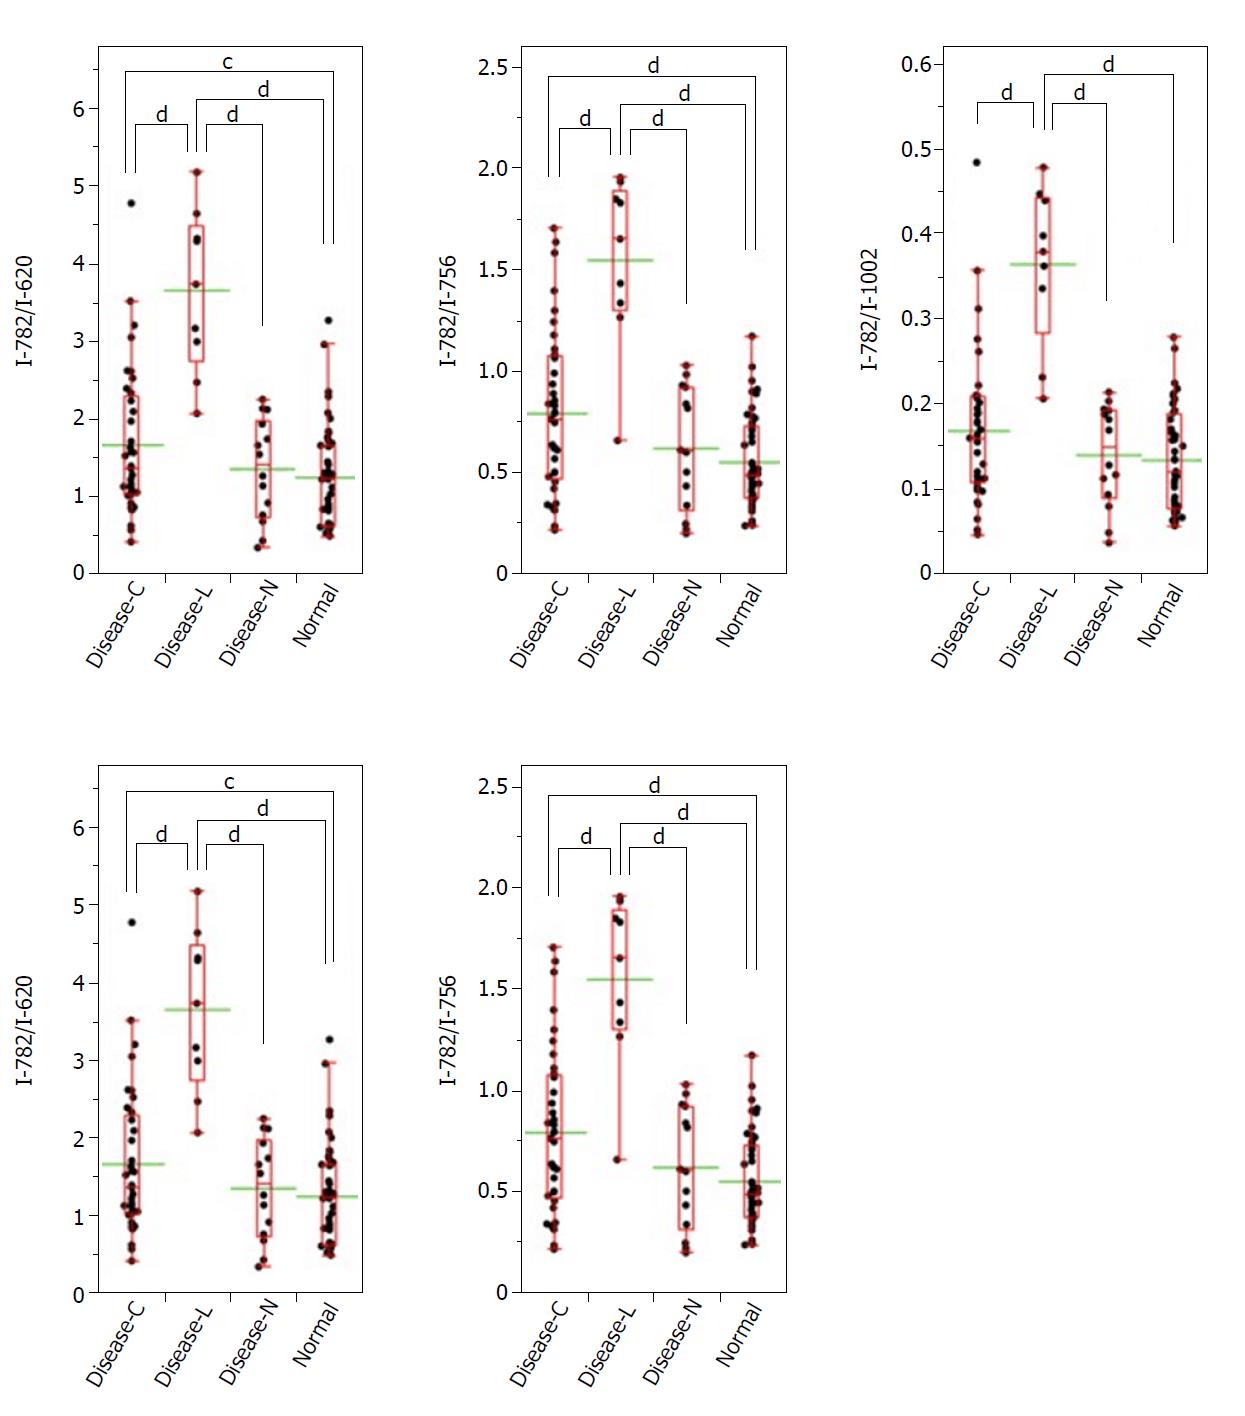
Figure 5 Raman scattering intensity ratio with the intensity of wavenumber 782 cm-1 as the denominator.
Dots indicate the ratio of the Raman scattering intensity in each tissue specimen of the patient. The bottom and top of the red box represent the lower and upper quartiles, and the band across the box shows the median. The lower and upper bars at the ends of the whiskers show the lowest data point within the 1.5 interquartile range of the lower quartile, and the highest data point within the 1.5 interquartile range of the upper quartile, respectively. The green bar shows the average. cP < 0.05, dP < 0.01.
- Citation: Ikeda H, Ito H, Hikita M, Yamaguchi N, Uragami N, Yokoyama N, Hirota Y, Kushima M, Ajioka Y, Inoue H. Raman spectroscopy for the diagnosis of unlabeled and unstained histopathological tissue specimens. World J Gastrointest Oncol 2018; 10(11): 439-448
- URL: https://www.wjgnet.com/1948-5204/full/v10/i11/439.htm
- DOI: https://dx.doi.org/10.4251/wjgo.v10.i11.439


