Copyright
©2009 Baishideng.
World J Gastrointest Oncol. Oct 15, 2009; 1(1): 41-46
Published online Oct 15, 2009. doi: 10.4251/wjgo.v1.i1.41
Published online Oct 15, 2009. doi: 10.4251/wjgo.v1.i1.41
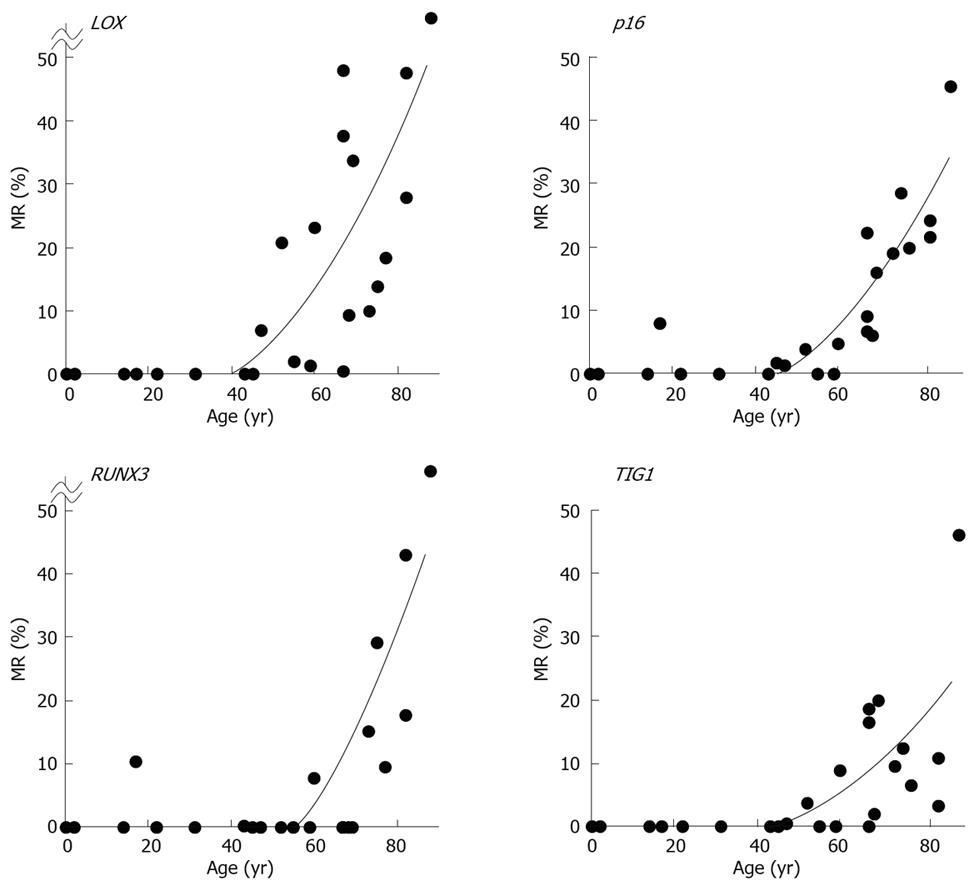
Figure 6 Regression curves.
LOX: y = 0.013x2 - 0.6184x + 4.0512, R2 = 0.5728, P < 0.001; p16: y = 0.0107x2 - 0.6055x + 5.2943, R2 = 0.7891, P < 0.00001; RUNX3: y = 0.0182x2 - 1.2234x + 11.566, R2 = 0.5595, P < 0.001; and TIG1: y = 0.0068x2 - 0.3586x + 2.4306, R2 = 0.4670, P < 0.01.
- Citation: Tamura G. Hypermethylation of tumor suppressor and tumor-related genes in neoplastic and non-neoplastic gastric epithelia. World J Gastrointest Oncol 2009; 1(1): 41-46
- URL: https://www.wjgnet.com/1948-5204/full/v1/i1/41.htm
- DOI: https://dx.doi.org/10.4251/wjgo.v1.i1.41


