Copyright
©2009 Baishideng.
World J Gastrointest Oncol. Oct 15, 2009; 1(1): 41-46
Published online Oct 15, 2009. doi: 10.4251/wjgo.v1.i1.41
Published online Oct 15, 2009. doi: 10.4251/wjgo.v1.i1.41
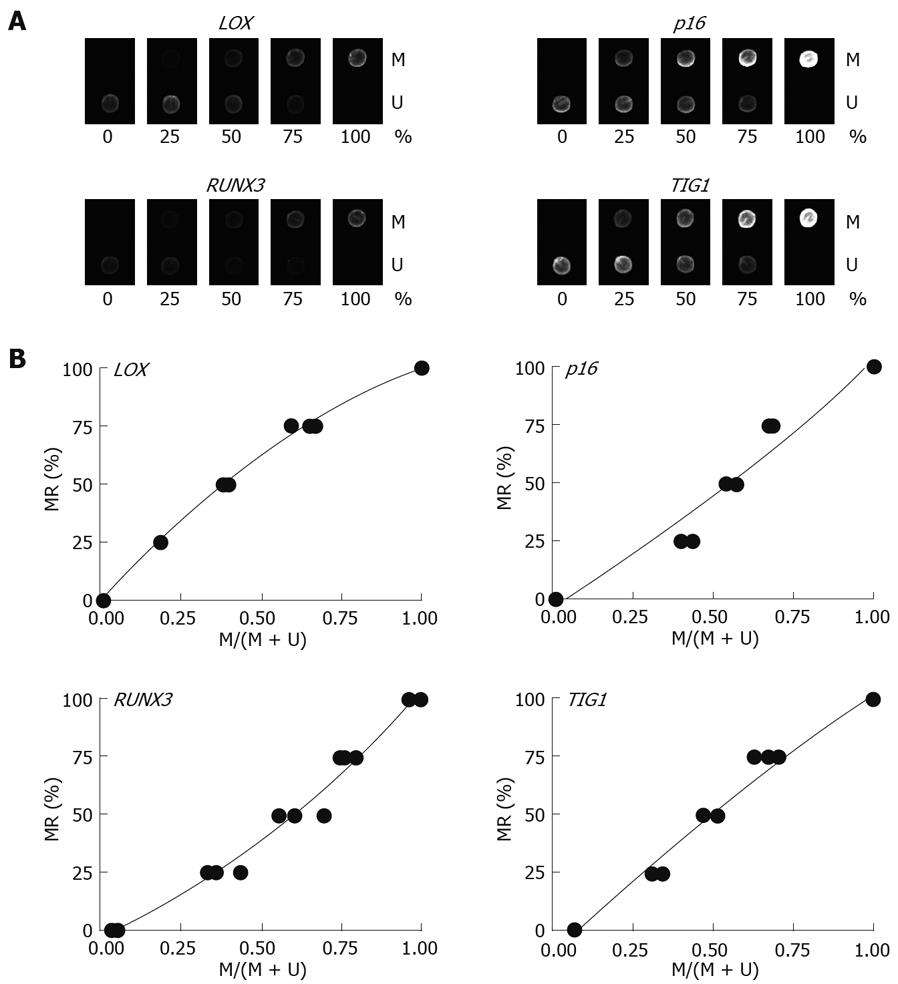
Figure 4 Standardization for DNA microarray analysis.
A: Microarray images of control DNAs with methylation rates of 0%, 25%, 50%, 75%, and 100%. M: Methylated sequence probe; U: Unmethylated sequence probe. Three replicates of the experiment were used to create standard curves. B: Standard curves were obtained for LOX: y = -49.256x2 + 150.4x - 1.0847, R2 = 0.9985; p16: y = 24.965x2 + 81.528x - 2.9098, R2 = 0.9617; RUNX3: y = 44.245x2 + 61.71x - 2.8558, R2 = 0.984; and TIG1: y = -20.932x2 + 133.9x - 11.113, R2 = 0.9852.
- Citation: Tamura G. Hypermethylation of tumor suppressor and tumor-related genes in neoplastic and non-neoplastic gastric epithelia. World J Gastrointest Oncol 2009; 1(1): 41-46
- URL: https://www.wjgnet.com/1948-5204/full/v1/i1/41.htm
- DOI: https://dx.doi.org/10.4251/wjgo.v1.i1.41


