Copyright
©The Author(s) 2024.
World J Gastrointest Oncol. Apr 15, 2024; 16(4): 1334-1343
Published online Apr 15, 2024. doi: 10.4251/wjgo.v16.i4.1334
Published online Apr 15, 2024. doi: 10.4251/wjgo.v16.i4.1334
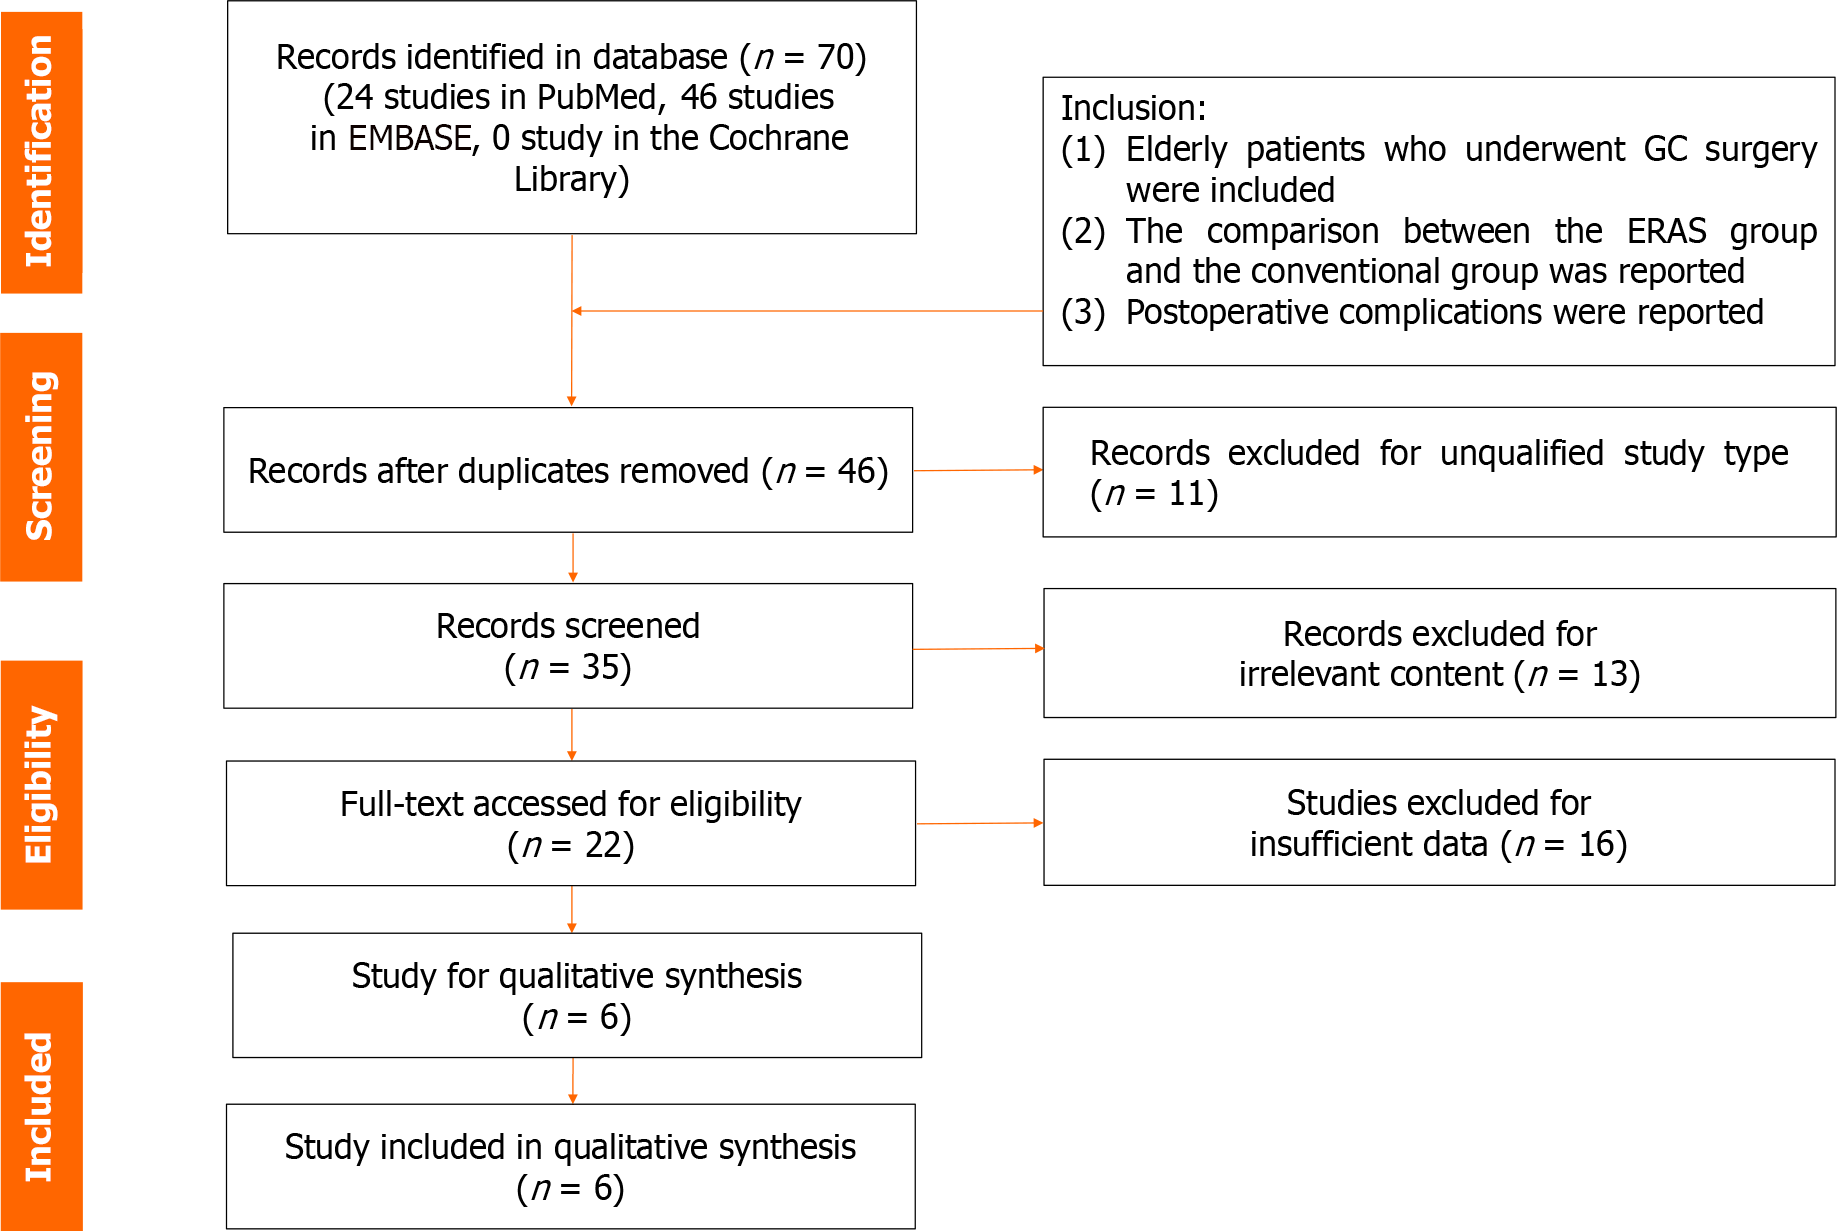
Figure 1 Flowchart of study selection.
Figure 2 Comparing major complications between the enhanced recovery after surgery group and the conventional group.
OR: Odds ratio; 95%CI: 95% confidence interval.
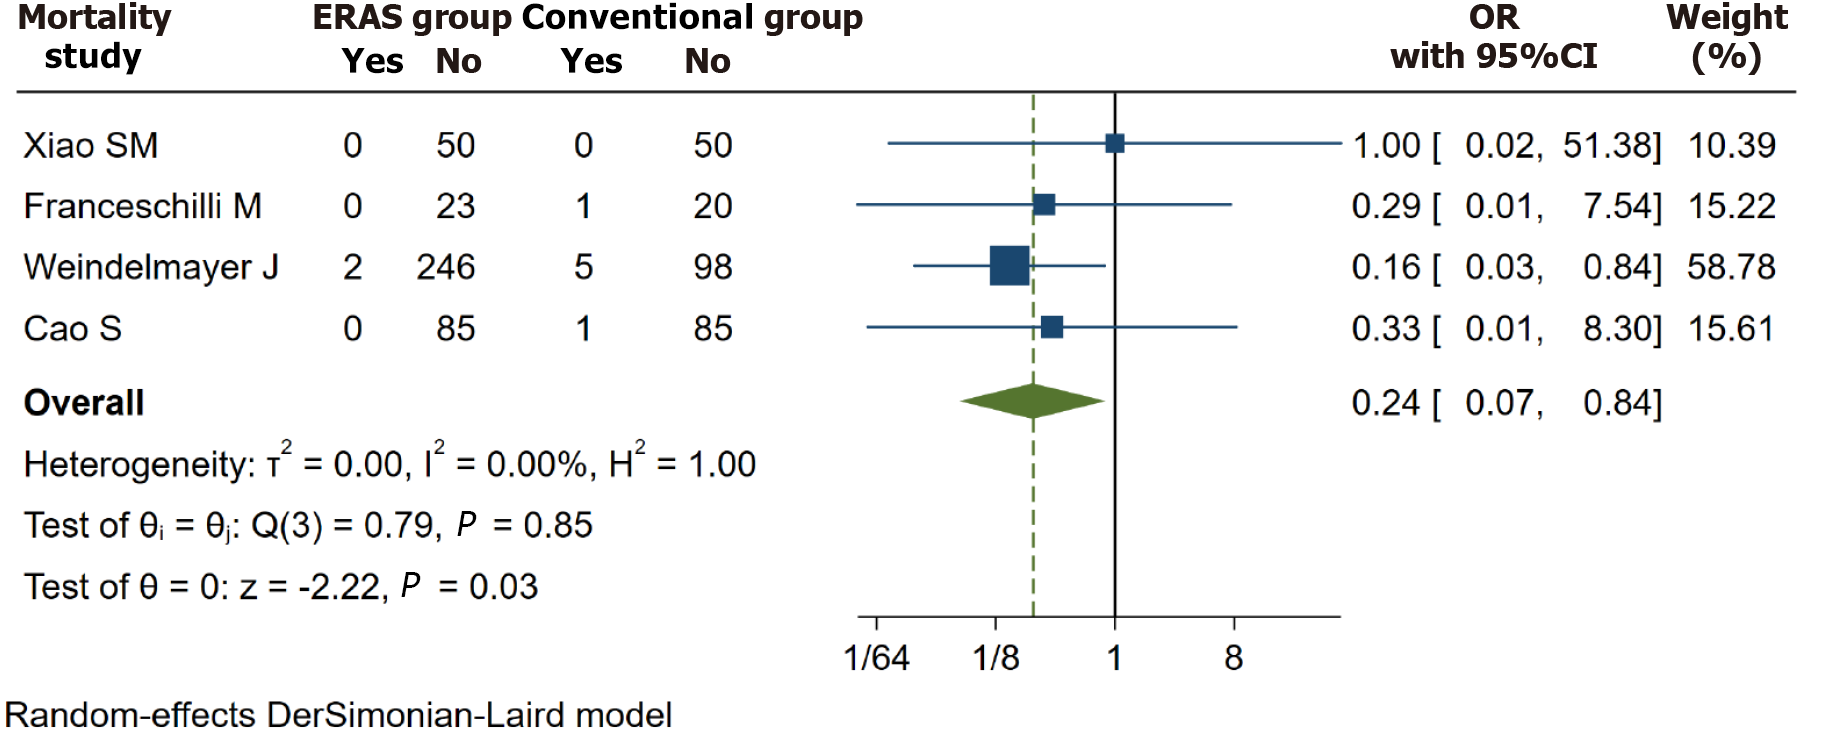
Figure 3 Comparing mortality between the enhanced recovery after surgery group and the conventional group.
OR: Odds ratio; 95%CI: 95% confidence interval.
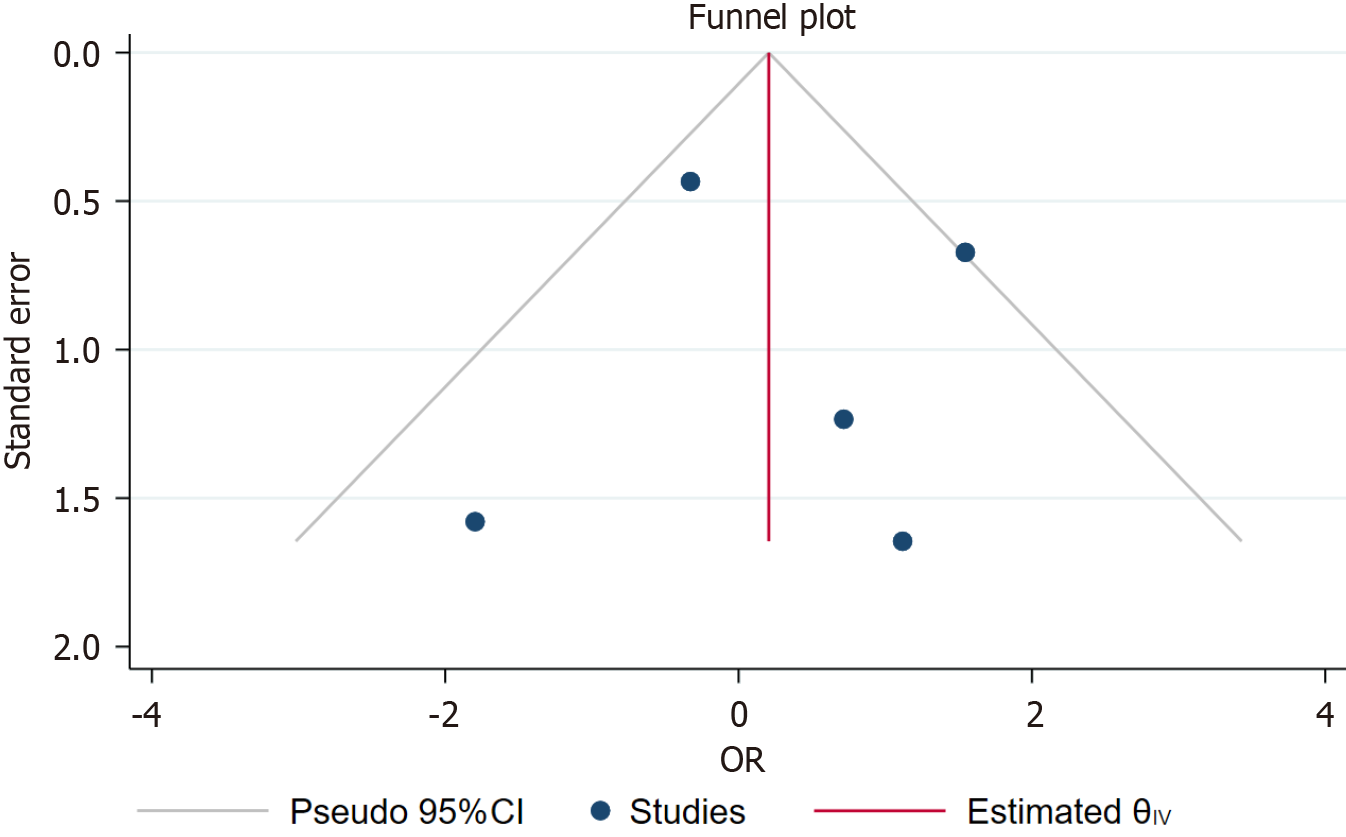
Figure 4 Funnel plot of readmission.
OR: Odds ratio; 95%CI: 95% confidence interval.
- Citation: Li ZW, Luo XJ, Liu F, Liu XR, Shu XP, Tong Y, Lv Q, Liu XY, Zhang W, Peng D. Is recovery enhancement after gastric cancer surgery really a safe approach for elderly patients? World J Gastrointest Oncol 2024; 16(4): 1334-1343
- URL: https://www.wjgnet.com/1948-5204/full/v16/i4/1334.htm
- DOI: https://dx.doi.org/10.4251/wjgo.v16.i4.1334


