Copyright
©The Author(s) 2024.
World J Gastrointest Oncol. Apr 15, 2024; 16(4): 1256-1267
Published online Apr 15, 2024. doi: 10.4251/wjgo.v16.i4.1256
Published online Apr 15, 2024. doi: 10.4251/wjgo.v16.i4.1256
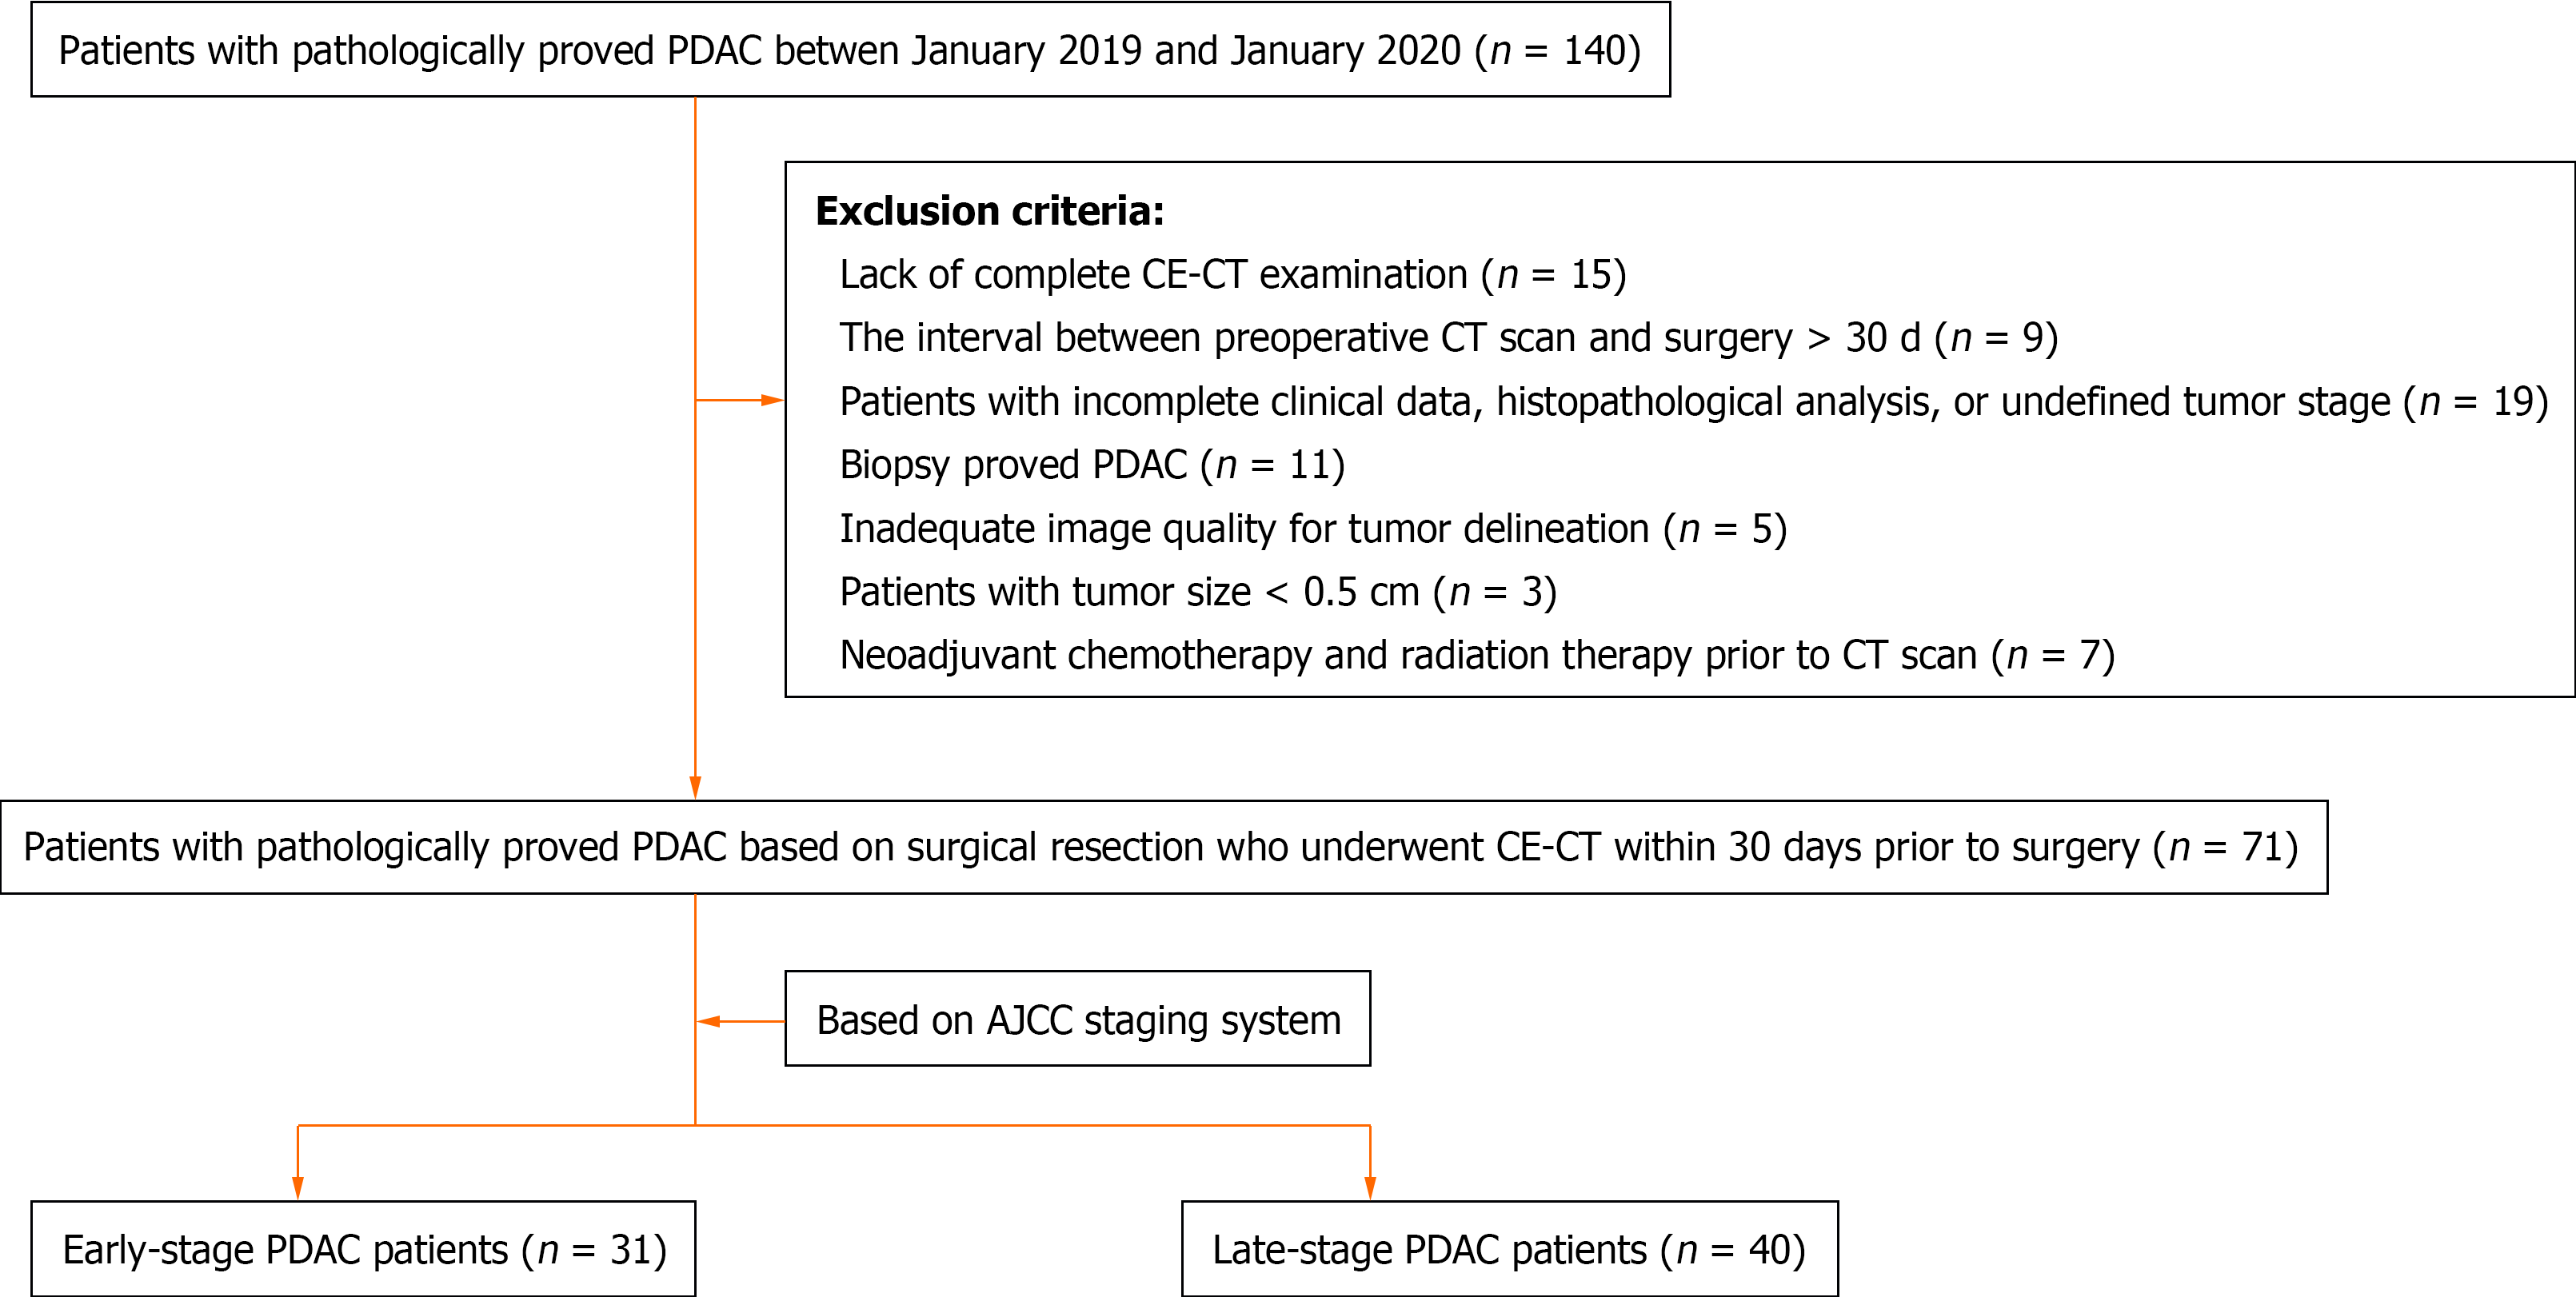
Figure 1 Flow diagram of patient inclusion.
PDAC: Pancreatic ductal adenocarcinoma; CE-CT: Contrast-enhanced computed tomography; AJCC: American Joint Committee on Cancer.
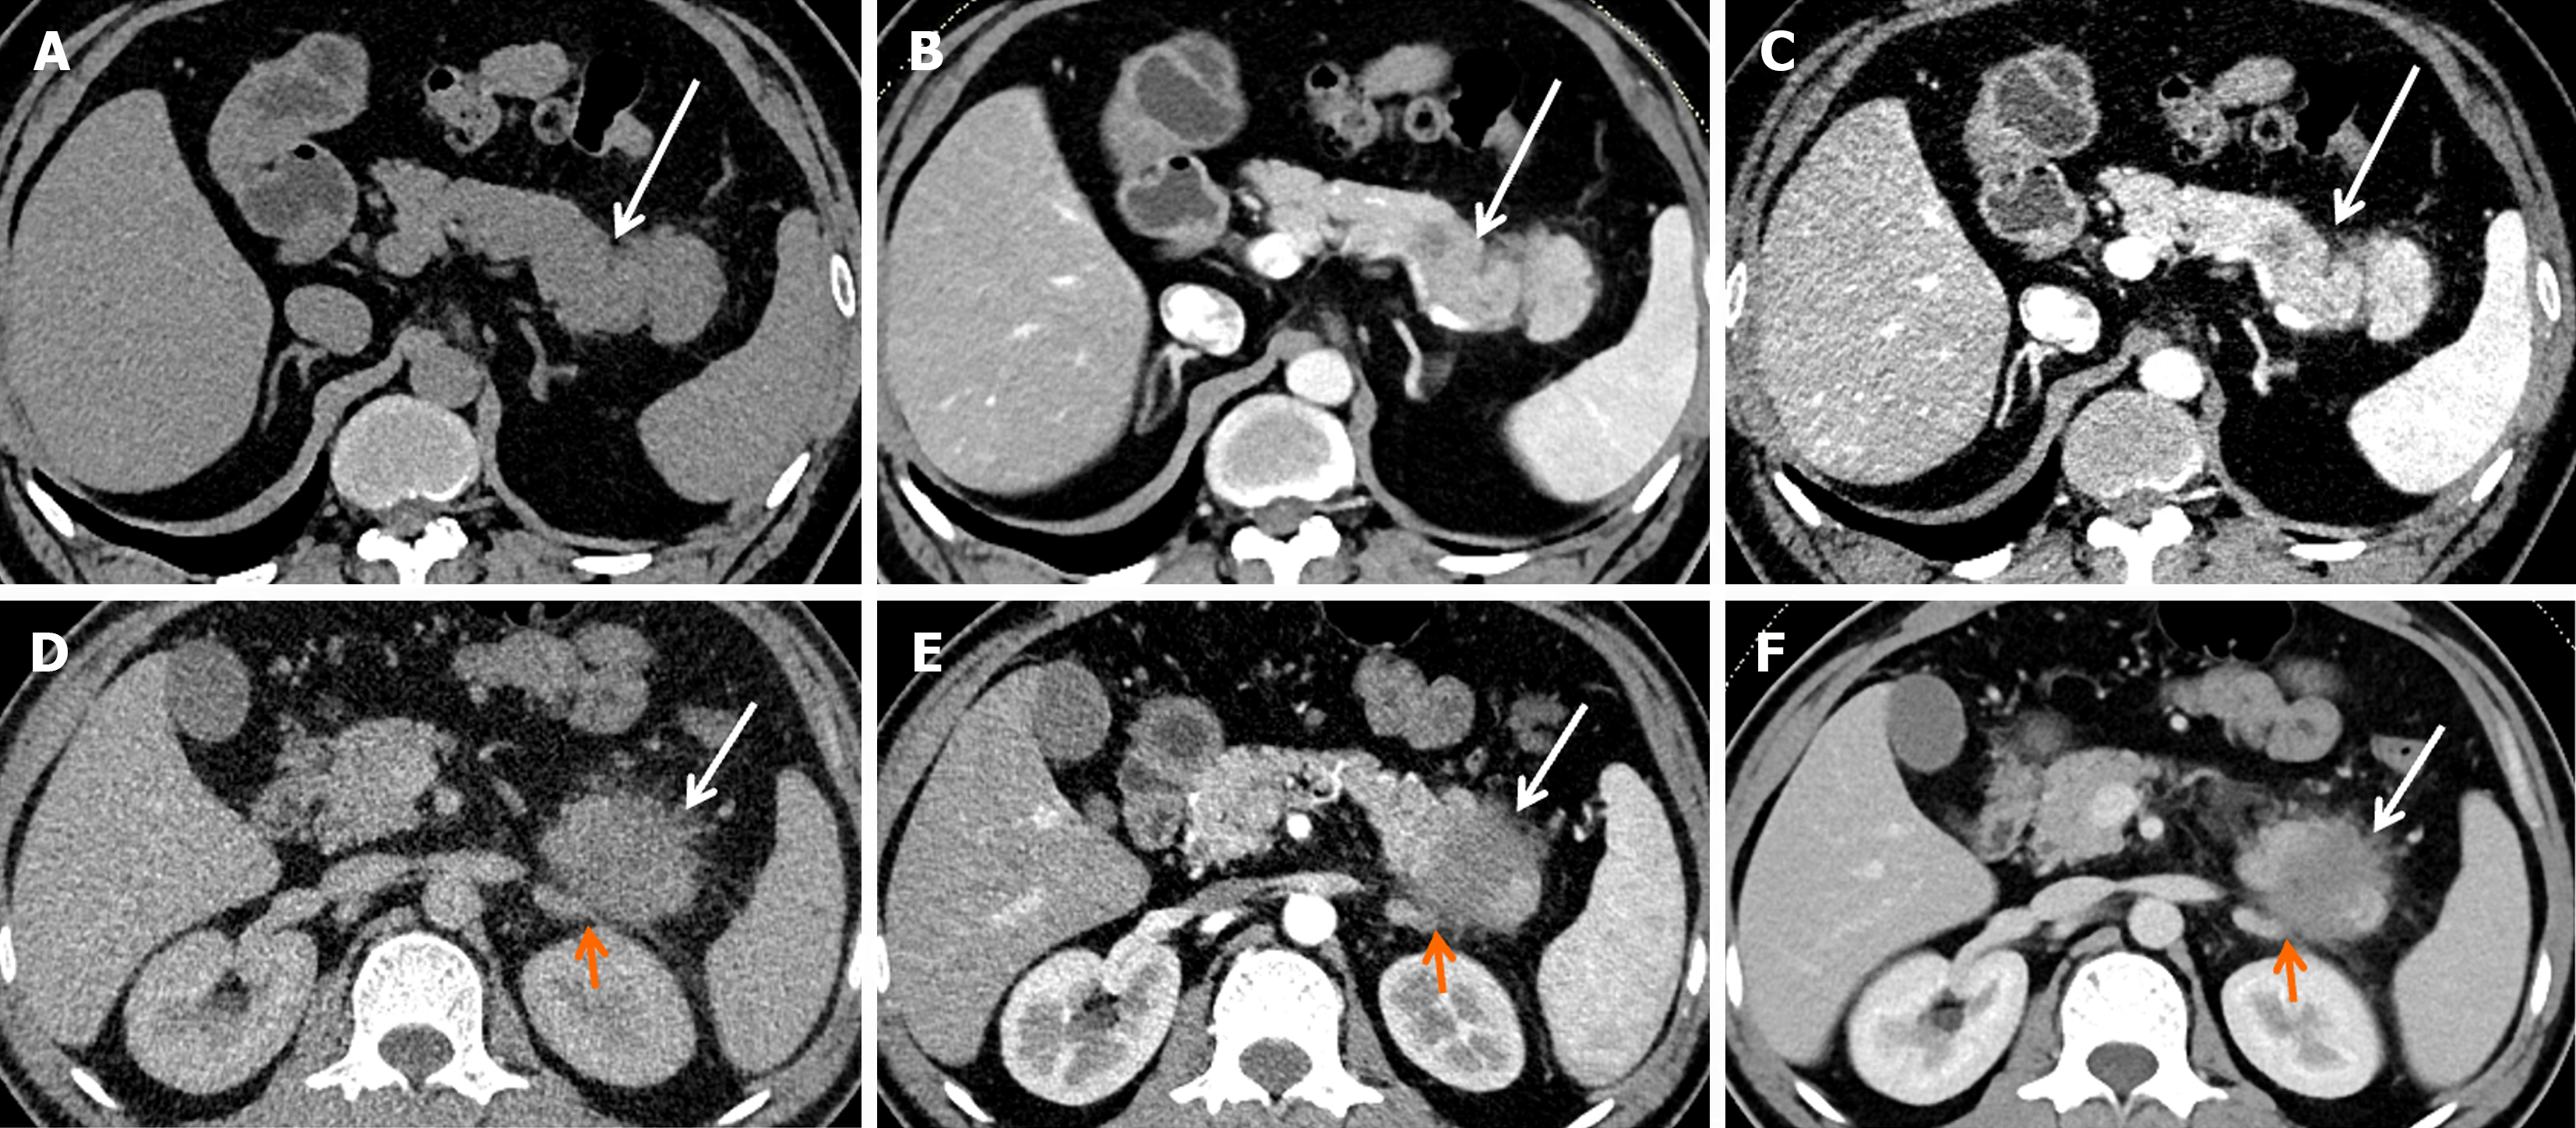
Figure 2 Computed tomography images of two representative cases of pancreatic ductal adenocarcinoma.
A-C: A 54-year-old man with stage IB pancreatic ductal adenocarcinoma (PDAC). Computed tomography (CT) imaging showed a well-defined, predominantly solid tumor (white arrow), 3.0 cm in diameter in the tail of the pancreas. No obvious lymph node metastasis, vascular invasion, or distal metastasis was found. TNM classification: T2N0M0 (IB); D-F: A 44-year-old man with stage IV PDAC. CT imaging showed an ill-defined, predominantly solid tumor (white arrow), 4.1 cm in diameter in the tail of the pancreas. The left adrenal gland (orange arrow) was grossly invaded by the tumor. TNM classification: T3N1M1 (IV).
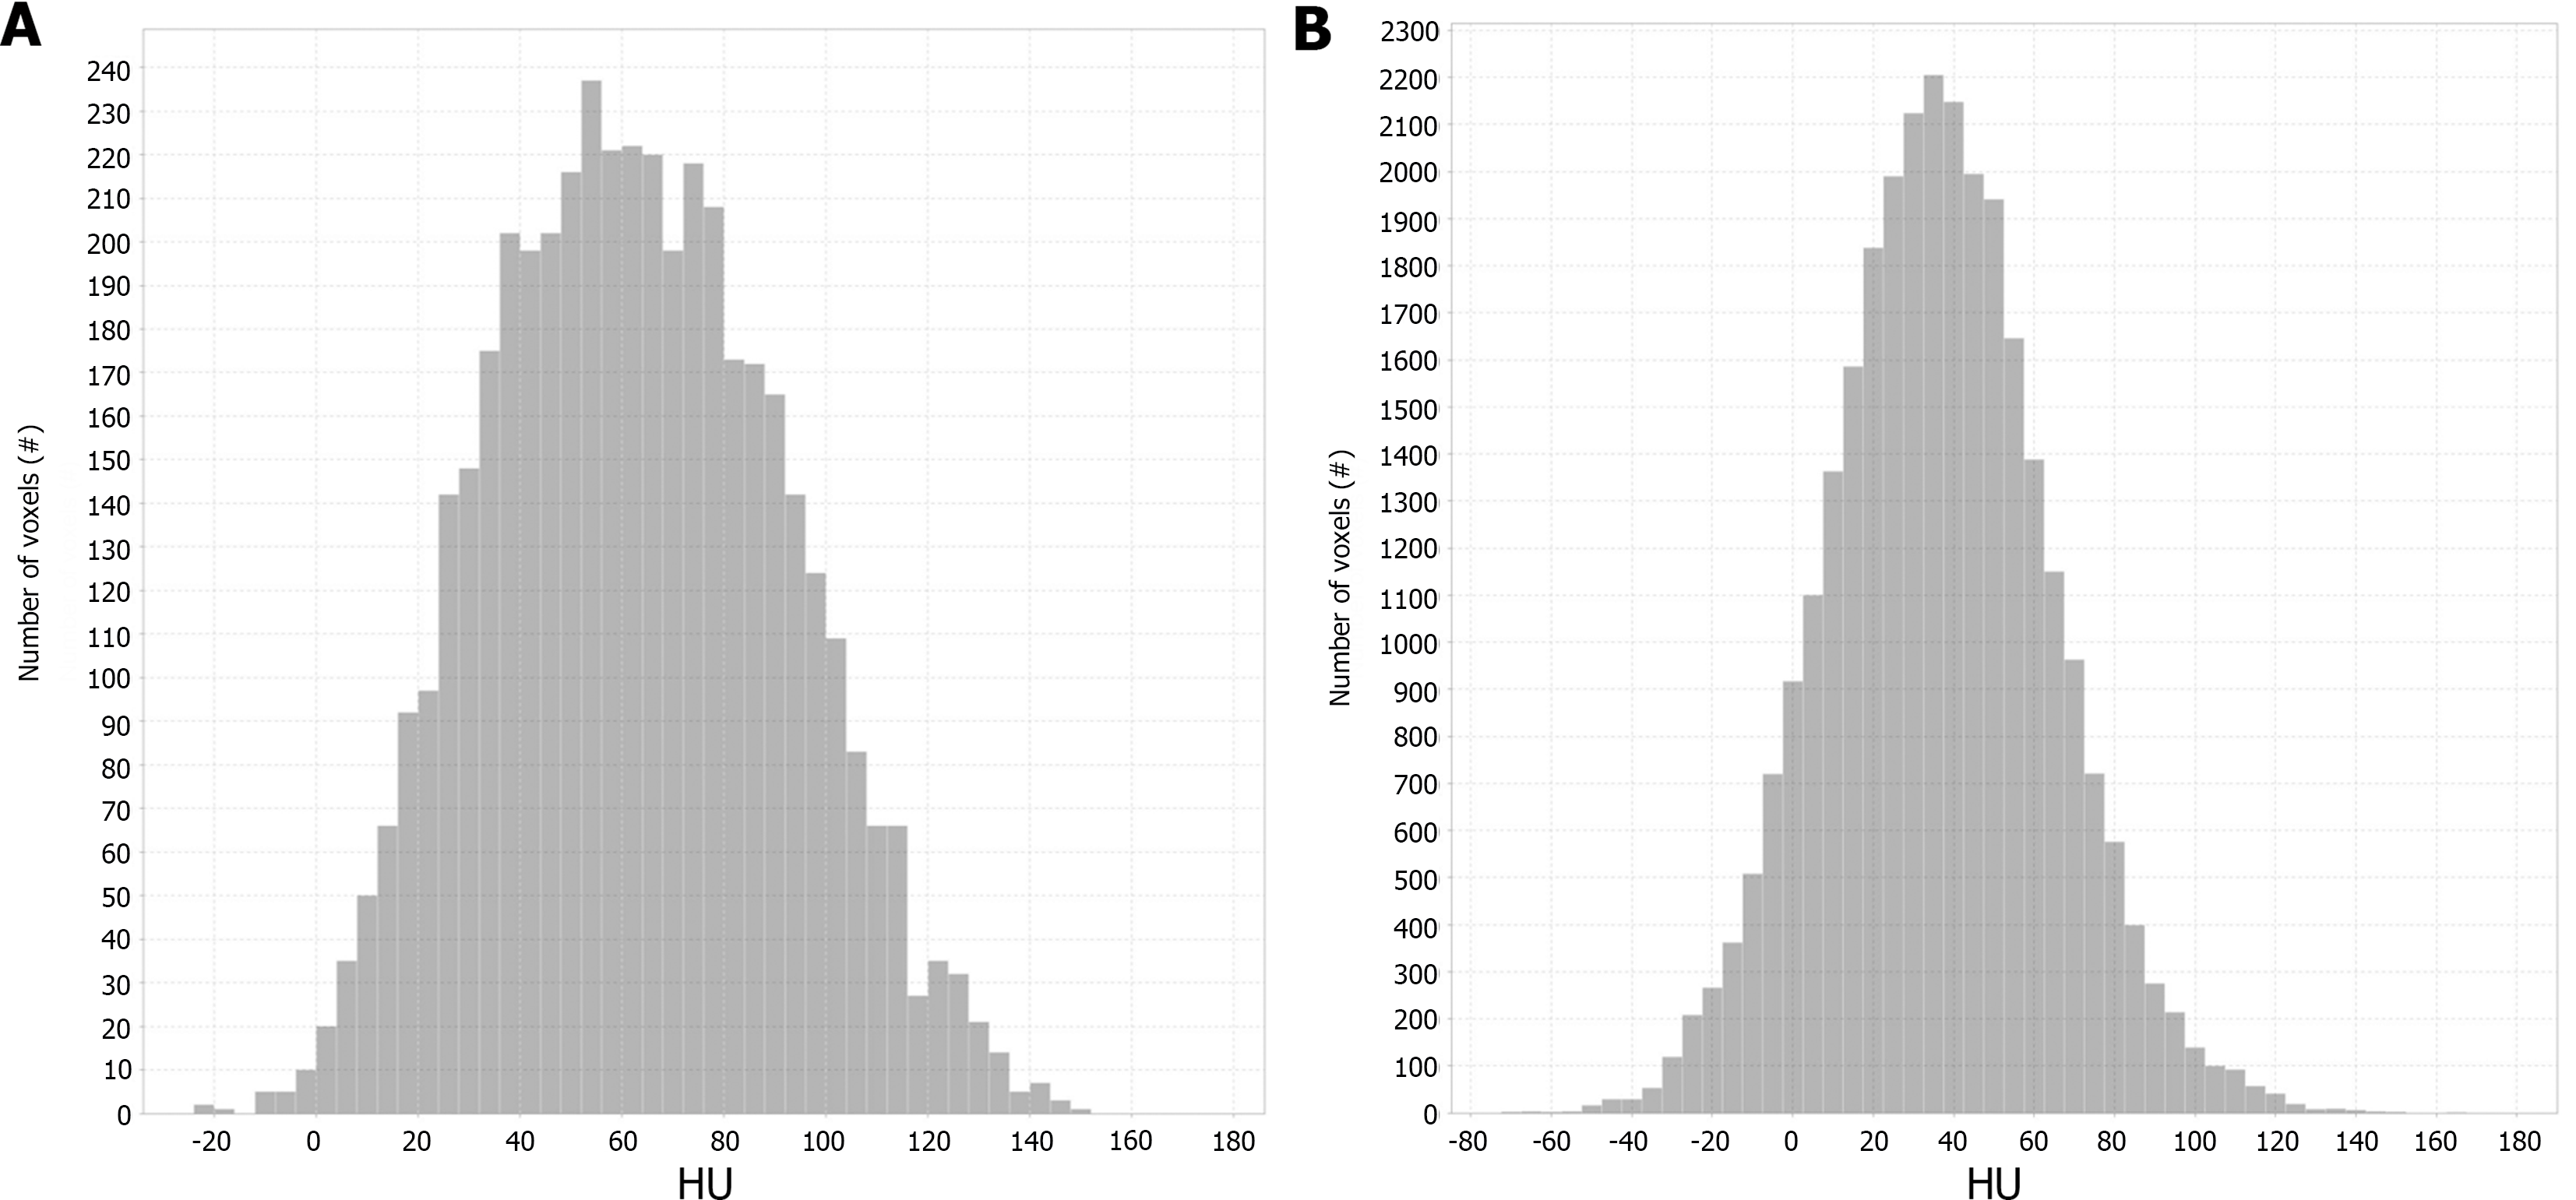
Figure 3 Histograms of two representative cases of pancreatic ductal adenocarcinoma.
A and B: Stage IB pancreatic ductal adenocarcinoma (PDAC), A vs stage IV PDAC, B, which showed a marked difference. The X-axis indicates the gray level (HU). The Y-axis indicates the number of voxels.
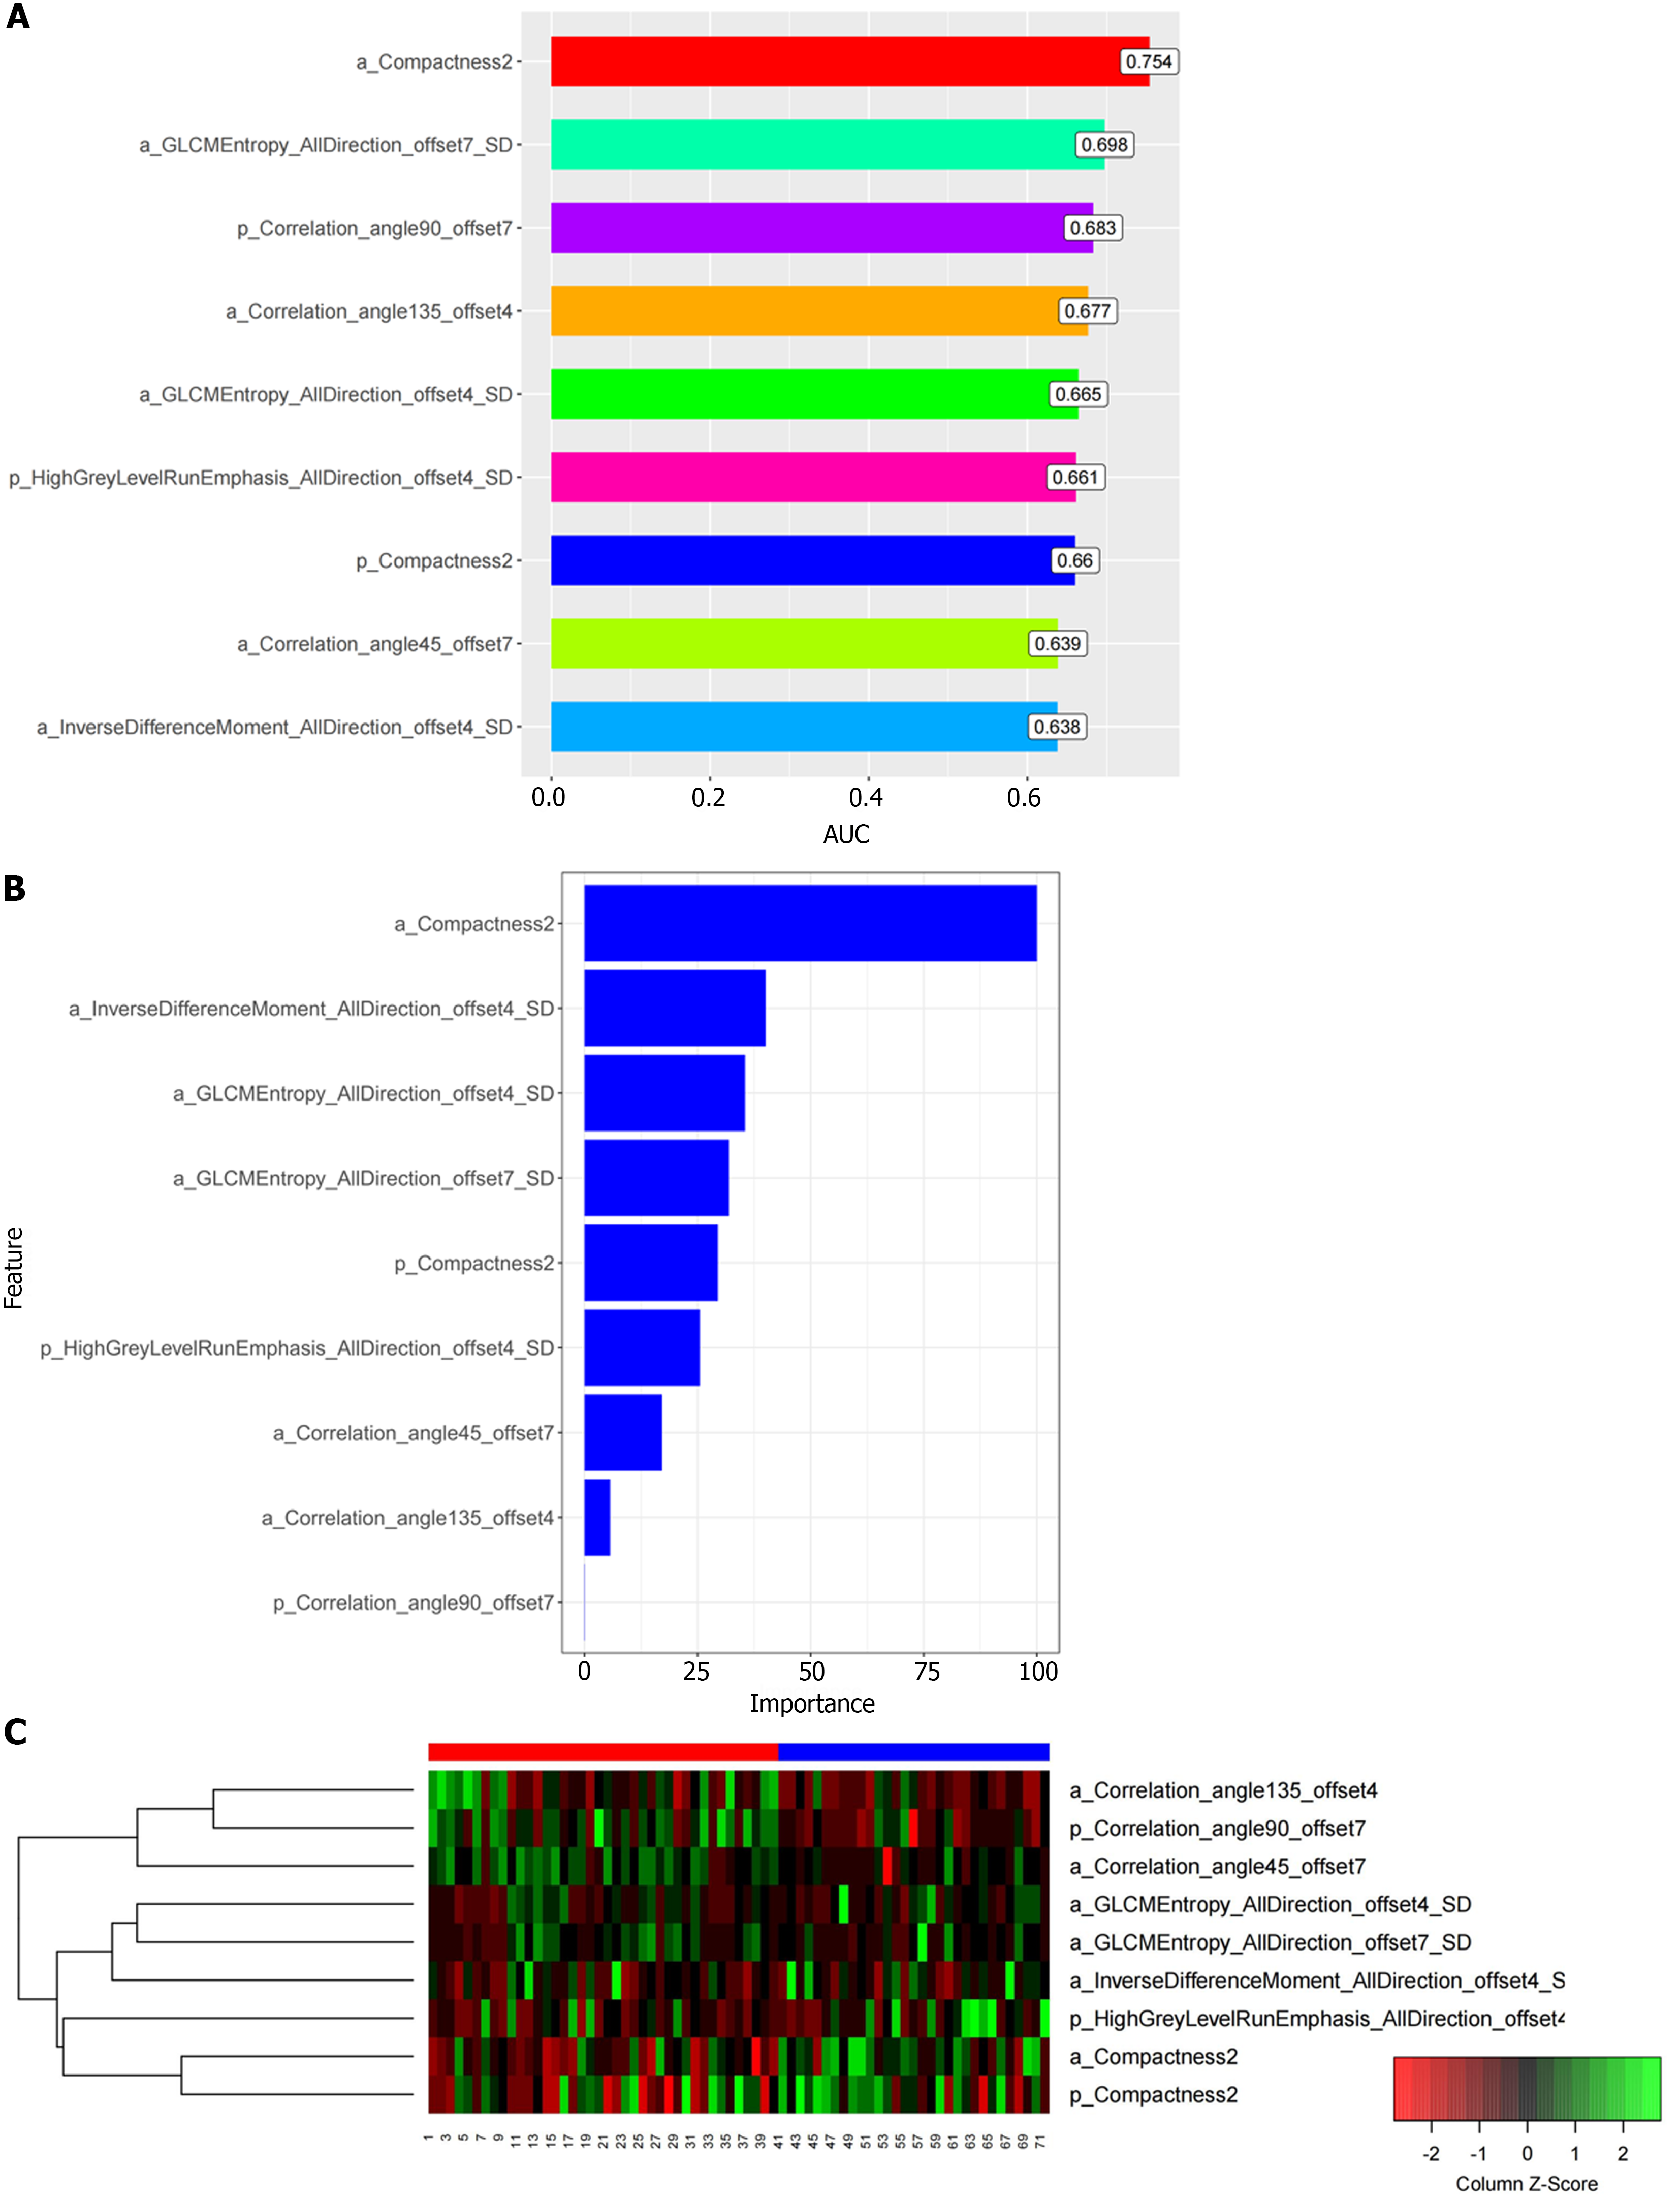
Figure 4 The area under receiver operating characteristic curve barplot, importance, and heatmap showing expression values of the selected features.
The feature importance plot was provided by the random forest methods as soon as the model train procedure completed. The importance of the feature was computed from permuting out-of-bag data. A: The area under receiver operating characteristic curve barplot of the selected predictive radiomics features; B: The importance of the selected predictive radiomics features; C: The heatmap showing expression values of the selected radiomics features (rows) of 71 pancreatic ductal adenocarcinoma patients (columns). AUC: Area under the receiver operating characteristic curve.
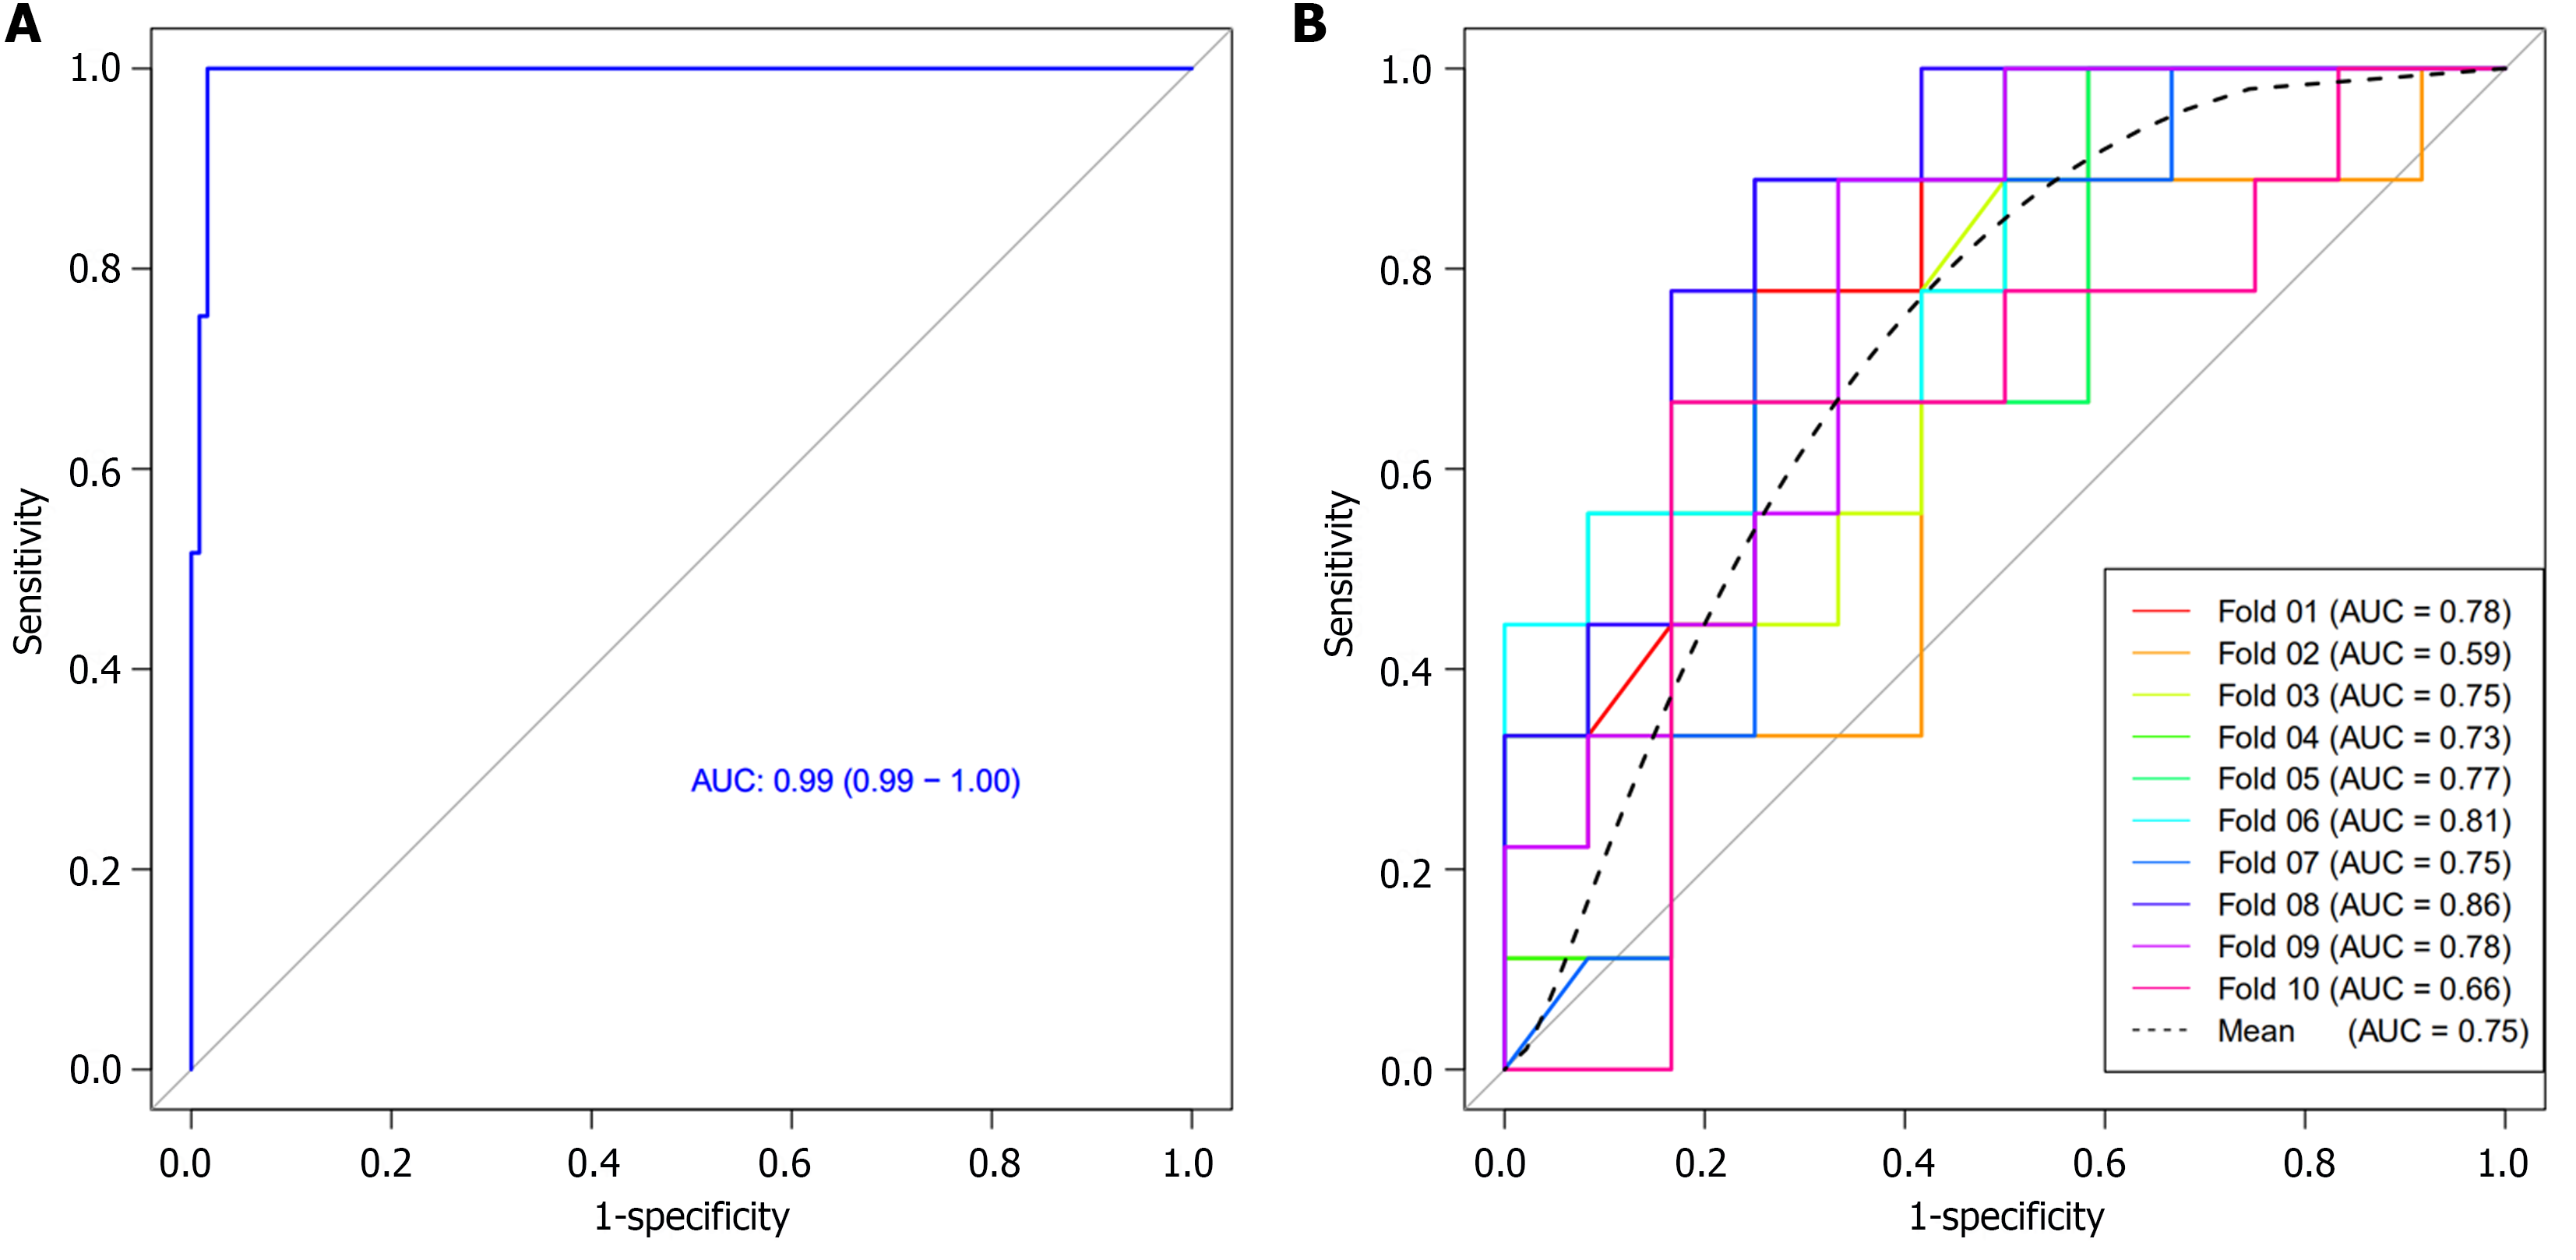
Figure 5 Receiver operating characteristic curve of the radiomics model and receiver operating characteristic curves of 10-times leave group out cross-validation analysis in differential diagnosis between early and late-stage pancreatic ductal adenocarcinoma.
A: Receiver operating characteristic (ROC) curve of the radiomics model based on computed tomography images in the differentiation of early and late-stage pancreatic ductal adenocarcinoma (PDAC); B: ROC curves of 10-times leave group out cross-validation analysis for the differentiation of early and late stage PDAC, with a mean area under the curve of 0.75 by the average performance of the 10 newly built models, indicating good predictive ability of the radiomics model. AUC: Area under the receiver operating characteristic curve.
- Citation: Ren S, Qian LC, Cao YY, Daniels MJ, Song LN, Tian Y, Wang ZQ. Computed tomography-based radiomics diagnostic approach for differential diagnosis between early- and late-stage pancreatic ductal adenocarcinoma. World J Gastrointest Oncol 2024; 16(4): 1256-1267
- URL: https://www.wjgnet.com/1948-5204/full/v16/i4/1256.htm
- DOI: https://dx.doi.org/10.4251/wjgo.v16.i4.1256


