Copyright
©The Author(s) 2017.
World J Gastrointest Endosc. Aug 16, 2017; 9(8): 396-404
Published online Aug 16, 2017. doi: 10.4253/wjge.v9.i8.396
Published online Aug 16, 2017. doi: 10.4253/wjge.v9.i8.396
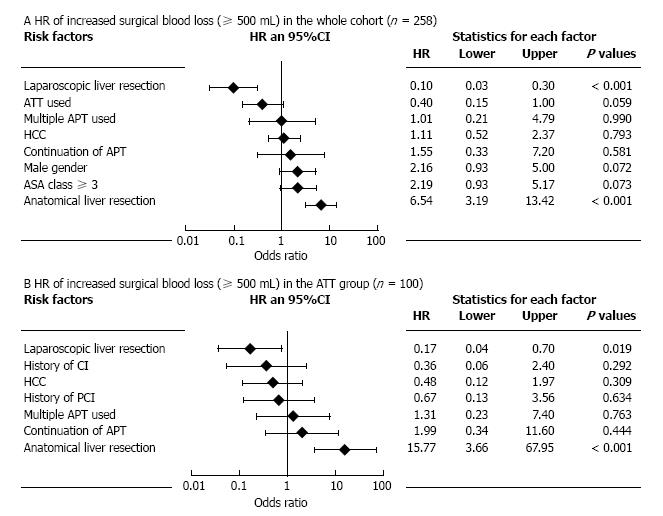
Figure 3 Forest plots showing hazard ratios of increased surgical blood loss.
A: Hazard ratios in the whole cohort (n = 258); B: Hazard ratios in the ATT group (n = 100). HR: Hazard ratio; ATT: Antithrombotic therapy; APT: Antiplatelet therapy; HCC: Hepatocellular carcinoma; ASA: American Society of Anesthesiolgists; CI: Cerebral infarction.
- Citation: Fujikawa T, Kawamoto H, Kawamura Y, Emoto N, Sakamoto Y, Tanaka A. Impact of laparoscopic liver resection on bleeding complications in patients receiving antithrombotics. World J Gastrointest Endosc 2017; 9(8): 396-404
- URL: https://www.wjgnet.com/1948-5190/full/v9/i8/396.htm
- DOI: https://dx.doi.org/10.4253/wjge.v9.i8.396


